LevelOne Logo
Header Background

Article Archive

Business Matters September 2018

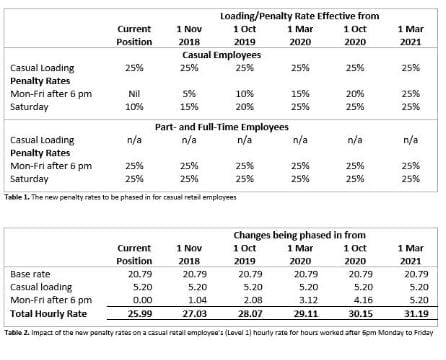
Casual Employee paid annual leave

Last month the Federal Court passed a ruling for a Queensland truck driver Paul Skene stating he was entitled to be paid accrued annual leave because he worked regular, predictable hours. This was despite him being paid casual loadings in lieu of those entitlements. This ruling is expected to be challenged by labour hire company Workpac.

“It is vital that parliament acts quickly to protect businesses, employees and the community from the huge potential cost impacts of the Federal Court’s decision in the WorkPac v Skene case,” Ai Group Chief Executive Innes Willox said.

The peak employer organisation warned this figure could blow out further with the inclusion of sick leave, redundancy pay and other entitlements, and called for urgent changes to national workplace laws to tighten the definition of a casual worker.

It would be very unfair to allow employees who have received a special loading as a casual to now be able to “double-dip” by also claiming annual leave and redundancy entitlements.

Tony Maher, the national president of the CFMEU, which brought the action on Mr Skene’s behalf, said the decision “underlines the extent to which Australian workers have been ripped off by the ‘permanent casual’ trend”.

Federal Labor has pledged to introduce a legal definition of casual employent, with leader Bill Shorten saying there would be “no such thing” as a permanent casual under a future Labor government.

Payroll tax grouping

Payroll tax grouping provisions cast the net very wide. Where entities are grouped, the members of the group will, effectively, have a single payroll tax threshold (currrently $850,000 in New South Wales) and, perhaps more significantly, be jointly and severally liable for the payroll tax debts of each member of the group.

Entities are grouped where they have specified common connections including:

  • where the entities are ‘related bodies corporate’ as defined in the Corporations Act 2001;
  • where the entities are commonly controlled – generally where a person or set of persons has a greater than 50% interest in different entities but in the case of companies, will include where the person or set of persons control the board;
  • where an entity has a ‘controlling interest’ in another entity – a ‘controlling interest’ for this purpose includes an indirect interest and an interest aggregated with associates;
  • where the entities use common employees; and
  • where 2 payroll tax groups have common members, all of the entities in the 2 groups form a single “super” group.

There are special rules around discretionary trusts that have the effect of significantly increasing the scope of the grouping provisions. A person falling within the class of beneficiaries of a discretionary trust (whether or not named) is treated as having a ‘controlling interest’ in the business carried on by the trust.

All trusts are treated as carrying on a business. Accordingly, a dormant trust or trust that only holds passive investments can be included in a payroll tax group.

If you are not sure if grouping applies to you – seek advice.

Inherited Property

When someone inherits a dwelling there are some special rules contained within the main residence exemption provisions that can provide a full exemption if certain conditions are met. If the conditions are not met, the beneficiary might face a nasty capital gains tax (CGT) bill for their good fortune.

In some cases, these conditions require the inherited property to be sold within two years of the date of death to qualify for the exemption, although the Commissioner has the discretion to extend this period in some situations. To simplify the tax requirements for beneficiaries (and executors) and ensure that they don’t have the threat of a large tax bill hanging over their head, the ATO has outlined a safe harbour for inherited property.

The safe harbour allows beneficiaries and executors to apply the exemption if the property is sold more than 2 years after the date of death without having to seek approval from the ATO, as long as the property is sold within 3 years of the date of death and certain other conditions are satisfied. This could be relevant where there was a delay in selling the property because of factors beyond the control of the beneficiary or executor such as a challenge to the will or where the complexity of the estate delays the completion of the administration process.

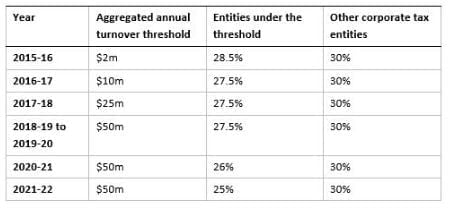
Company tax and franking rate

Legislation passed by Parliament late last month introduces a new test that will restrict some companies from accessing the lower company tax rate from the 2017-18 financial year.

Across a 3 year period, the company tax and franking rate changed, then the definition of what is a small business entity changed (from a $2 million to $10 million turnover) along with how the franking rates apply, and now we have a whole new set of definitions and rates that have come into play. Complicating the change is the issue of timing; the legislation was passed by Parliament after the end of the 2018 financial year and could impact on not only the tax rate that applies for the year ended 30 June 2018 but also the franking rate on dividends paid since 1 July 2017.

For the 2017-18 income year, the lower company tax rate of 27.5% is available to ‘base rate entities’. This means a company that had an aggregated turnover of less than $25 million and no more than 80% of its assessable income for the year was classified as “base rate passive income” (which includes things like rental income, interest and some dividends). While the new $25 million turnover threshold is good news for many companies, the new passive income test will create a problem for others and potentially move them from the reduced rate to the higher general 30% company tax rate. This also has an impact on the maximum franking rate that applies to dividends paid by companies in the 2018 income year onwards.

For the 2018-19 financial year onwards, the turnover threshold has been increased to $50 million.

The problem with the new passive income test is that it is not just a gross turnover test but a test that requires an analysis of the components of that turnover. The new test adds another layer of complexity going forward.

Maximum franking rate

The new rules also make changes to the maximum franking percentage rules. To determine a company’s maximum franking rate for a particular income year from the 2018 income year onwards, you need to look at the tax rate that would apply in the current year if the following assumptions are made:

  • The company’s aggregated turnover in the current year is the same as in the previous year;
  • The company’s assessable income in the current year is the same as in the previous year; and
  • The company’s passive income in the current year is the same as in the previous year.

For example, if a company paid a franked dividend in the 2018 income year, its maximum franking percentage will be based on a 27.5% rate if:

  • The company’s aggregated annual turnover in the 2017 year was less than $25m; and
  • 80% or less of the company’s assessable income in the 2017 year was passive income.

If the company did not exist in the previous income year, then the maximum franking rate will be based on a 27.5% rate.

If a company paid a dividend in the 2018 income year and this was initially franked to 30% but the new rules mean that the maximum franking rate should have been 27.5%, then it will be necessary to inform the shareholders of the correct franking rate and ensure that the company’s franking account balance is adjusted accordingly.

All clear now? The company tax rate changes can be complex. If you are concerned about the impact of the new rules or would like our assistance to manage any dividend issues, please call us.

Quote of the month

“Most folks are about as happy as they make up their minds to be.”

Abraham Lincoln

Quarterly Review October 2018

Share Market Update

The Australian share market has finished the September quarter up 0.21% (before dividends), or up 1.53% including dividends.

Most sectors performed flat or negatively over the quarter with the ASX Financials sector the worst performer down 2.43%. Energy and Resources fared better down 0.12% and 0.13% respectively for the September quarter.

Market volatility has increased due to the threat of trade wars and other potential destabilising factors occurring abroad. Good company earnings results have helped investment markets both here and overseas to navigate this volatility.

The US market is trading at all time highs, with the highest point on record being 26,743.50 on 21st September 2018. This compares to a Dow Jones index of 18,327.29 on 8th November 2016 when Trump was elected. Which is an increase of almost 46%.

Despite the Australian Share market ASX200 sitting at 10 year highs, our market is still to reach pre-GFC levels. The Australian Share market (ASX/200) reached a market high of 6,873.20 on 1st November 2007, followed by a low of 3,120 in March 2009. Our market closed at 6,207.56 on 28th September 2018.

By comparison, the US market peaked at 14,164.53 pre-GFC on 9th October 2007. The low point in the GFC occurred on 6th March 2009 when the Dow Jones dipped to 6,443.27. The Dow Jones closed at 26,443.15 on 28th September.

Accordingly, we have been increasing our cash holding of late.

Economic Update

As of September, the cash rate has been kept on hold at 1.50% for 25 consecutive months by the Reserve Bank of Australia (RBA).

In the September meeting minutes, the Board stated that the “…members continued to agree that the next move in the cash rate would more likely be an increase than a decrease…they also agreed there was no strong case for a near-term adjustment in monetary policy…” after all things considered.

The Board continue to see their stoic position with regard to monetary policy as “…a source of stability and confidence…” in achieving sustainable economic growth and the inflation target over time.

Australia’s economic growth remained strong in the June quarter, with GDP increasing 0.9% q/q in Q2, bringing annual growth (through-the-year) to 3.4% – the fastest rate of increase since the September quarter 2012. Growth was driven by solid pick-up in domestic demand with improving household consumption offsetting a decline in business investment. Net exports also made a positive contribution to growth in the quarter.

We expect momentum to remain positive in the near term, with exports boosted by new LNG capacity, renewed growth in public investment and an anticipated rebound in business investment. However, this will be undermined by softer consumer demand as employment growth slows, and by an expected decline in residential investment from the second half of this year. We see GDP growth remaining at 2.9% in FY19, before slowing to 2.6% in FY20.

Australian households have adapted to the stall in income growth by reducing their savings, allowing momentum in consumer spending to remain robust. As a result, the household saving ratio has fallen to its lowest level in 10 years. However, there isn’t much more room for the saving ratio to fall, which will put the brakes on further increases in consumer spending until the pace of household income growth accelerates.

Jobs growth bounced back in August, with a 44,000 increase in employment. Of this, 33,700 were full-time positions. The increase was matched by an increase in the labour force, with the participation rate increasing by 0.2%pts to 65.7%, which kept the unemployment rate steady at 5.3%.

Output growth is catching up with last year’s bumper increase in jobs, with the economy expanding at its fastest pace since 2012 in the June quarter. However, we expect the pace to moderate in the coming months as the residential downturn takes hold and momentum in consumer spending cools. This will put a dampener on the labour market, and we expect the patchy performance seen so far this year to continue into 2019.

Source: BIS Oxford, RBA, UBS

Property Market Update

Source CoreLogic

Without a doubt, housing risks are heightened relative to a year ago. Dwelling values are slipping lower nationally (down 2% since peaking in September last year), mortgage rates are edging higher (up by around 15 basis points from three of the four major banks announcing a rate rise in September) and mortgage arrears have moved off their record lows (but still only around 0.6% of all mortgages are 90+ days in arrears). All this against a backdrop of record high levels of household debt (the ratio of disposable income to household debt reached 190% in March this year), increasing levels of housing supply and rising domestic and global uncertainty.

Australia’s largest housing market, Sydney, has seen values fall by 5.6% since peaking in July last year; a trajectory that is straight down the middle of previous downturns. During the GFC, Sydney dwelling values fell by 7.0% in the space of twelve months, and the downturn before that (2003-2006) saw values fall 7.1% over the same number of months.

Australia’s second largest city, Melbourne, has seen values falling since November last year. Since that time the market is down a cumulative 3.5% and the descent has generally been milder relative to previous downturns. Perth dwelling values peaked in 2014 and have fallen by 12.6% and in Darwin where conditions have been even tougher, dwelling values are down 21.8%.

Forecasting the movement in asset values is challenging at the best of times. With so much uncertainty at the moment it’s even harder. Several wildcards remain that could have a negative impact on the direction of housing values.

Households are more sensitive than ever to interest rate movements due to the record level of household debt. Roughly 70% of household debt is housing related, which implies small changes to mortgage rates could have an amplified impact on household balance sheets. Further out of cycle movements in mortgage interest rates could have a negative impact on the market. On the flipside, if the RBA decides to cut the cash rate further (a possible scenario of economic conditions weakened and housing price falls accelerated), this would likely see a rise in housing activity and help to place a floor under housing prices.

There is also the potential for changes to property taxation policies that could have a further dampening effect on investment demand. A Shorten Labor Government would reduce the capital gains tax discount from 50% to 25% and restrict negative gearing to new dwellings only.

Based on the value of new housing finance commitments, investors still comprise around 41% of mortgage demand, down from 55% in mid-2015. Investor concentrations remain well above their long term averages across New South Wales (49% of housing finance commitments) and Victoria (41% of housing finance commitments), implying Sydney and Melbourne would have more to lose if investor activity were to drop more substantially. Investors are already being disincentivised by falling prices, mortgage rate premiums and low rental yields; additional disincentives from tax reform could see demand reduce further, creating some slack in the overall demand composition for Australian housing.

In balance, even with mortgage rates edging higher, we are still in the lowest mortgage rate environment since the 1960’s. Population growth remains strong and maintaining a consistent migration policy seems to have support from both sides of politics which will continue to support demand for housing. Labour markets are reasonably healthy with unemployment holding at 5.3% and likely to trend lower, underemployment at the lowest rate since May 2014 and jobs growth above the long term trend.

Overall, it’s hard to see a scenario where Australian housing values could fall off a cliff. For this to happen we would need to see a material about face in labour market conditions, a global shock or a material rise in interest rates – none of which seems to be a likely outcome at the moment.

Business Matters October 2018

Retailers on Short Notice for New Penalty Rates from 1 November 2018

In a decision released on 27 September 2018, the Fair Work Commission (Commission) has made changes to penalty rates for all retail employees covered by the General Retail Industry Award 2010 (Award). The changes will apply from 1 November 2018.

The Commission’s review of the Award has distinguished between the purpose of casual loadings and penalty rates and their decision has been made to ensure that the Award provides a “fair and relevant minimum safety net of terms and conditions”.

Going back to fundamentals, the purpose of the casual loading is to compensate casual employees for the fact that they are not entitled to sick leave or annual leave. Whereas penalty rates are intended to compensate employees for the inconvenience associated with working late nights, weekends and at odd hours.

The Commissioner has determined that penalty rates should be increased for casual employees in line with the penalty rates received by part- and full-time employees for hours worked after 6pm Monday to Friday and for all hours worked on Saturdays. The rates will be increased over three years as per the table below. The penalty rates are received in addition to the 25% casual loading and are outlined in Table 1.

Table 2 below illustrates the change in the hourly rate for a casual retail employee (Level 1) with the changes to the Mon-Fri after 6pm penalty rate.

In the same decision, the Commissioner has also decreased the penalty rates for shift workers.

Sunday penalty rates will still undergo the staged reduction as per the Productivity Commission report into workplace relations from earlier this year.

We expect that news of the decision is sure to cause headaches for retail businesses in the lead up to Christmas as the unbudgeted changes hit their bottom line as they scale up their workforce in preparation for the busiest time of year in retail. Furthermore, many small businesses will remain ignorant of the change for some time to come and inadvertently underpay their employees.

Gift cards

In Australia, around 34 million gift cards are sold each year with an estimated value of $2.5 billion. On average, an estimated $70 million is lost because of expiry dates.

Applying from 1 November 2019, new laws are in effect that introduce a regime for the regulation of gift cards including:

  • A minimum 3 year expiry period
  • Bolstering disclosure requirements, and
  • Banning post-supply fees.

What business needs to do

From 1 November 2019, businesses should ensure:

  • All gift cards have a minimum three year expiry period. Any existing gift card stock should be run down and production reviewed to ensure that once the new regime comes into effect, only compliant gift cards are issued.
  • Ensure disclosure requirements are met. The expiry date or the date the card was supplied and a statement about the period of validity must be set out prominently on the gift card itself. For example, if the supply date was December 2019, “Supply date: December 2019. This card will expire in 3 years,” or “Valid for 3 years from 12/19”. It is assumed that the card expires on the last day of the month where only the month and year are displayed. If the gift card does not expire, the card will need to clarify this by stating words to the effect of, “never expires”.
  • Post-supply fees are not charged. A post-supply fee is a fee that is charged reducing the value of the gift card such as administration fees for using a gift card. Post-supply fees exclude the fees that are normally charged regardless of how someone pays for a product or service. For example, booking fees, a fee to reissue a lost or damaged card, and payment surcharges.

A number of larger businesses have adopted a 3 year expiry period following the introduction of NSW laws. These include David Jones, Myers, Westfield, Rebel Sport, Coles, and Dymocks. Other retailers have no expiry dates including iTunes, JB Hi-Fi, EB Games, Woolworths and Bunnings. Generous expiry periods are a point of difference when consumers are working out which retailers gift card to purchase.

What happens if a business ignores the new rules?

Once the new rules come into effect, if a gift card is supplied with less than a three year expiry period, the disclosure requirements are not met, or post-supply fees are charged, a penalty may be imposed of up to $30,000 for a body corporate and $6,000 for persons other than a body corporate. In addition, the ACCC has the ability to impose infringement notices. Each infringement notice is 55 units (currently $11,500) for a body corporate and 11 units (currently $2,420) for persons other than a body corporate.

What happens if a business becomes insolvent or is sold?

The consumer’s rights do not change if the business becomes insolvent or bankrupt. The consumer becomes an unsecured creditor of the business.

If a business changes owners, the new owner must honour existing gift cards and vouchers if the business was:

  • sold as a ‘going concern’. That is, the assets and liabilities of the business were sold by the previous owner to the new owner.
  • owned by a company rather than an individual, and the new owner purchased the shares in the company.

Santa Issues

An anti-social media Christmas party

Most businesses have a good understanding of the impact of alcohol, sexual harassment, bullying and anti-social behaviour at Christmas parties.

It’s a good time to remind employees that the staff Christmas party is considered to be the workplace and they need to protect the reputation of the company.

Gift giving

Gifts for employees need to be kept below $300 per person. The Tax Office consider it to be a minor benefit and as such, exempt from FBT. Gifts above this level are deductible to the business but FBT will apply.

If the gift is for a client, gifts are deductible as long as the gift is given by the business with the expectation that the business will benefit (ie. the gift is given with the expectation of generating revenue).

Spreading the joy – entertaining clients

Entertaining your clients at Christmas is not tax deductible. So, if you take them out to a nice restaurant, to a show, or any other form of entertainment, then you can’t claim it as a deductible business expense and you can’t claim the GST credits either.

Clause with a cause

Charity gifts are an increasingly popular form of corporate giving. For tax purposes, you can only claim a tax deduction for donations made to deductible gift recipients (DGRs). If you or your client receive anything for the donation, then it’s not tax deductible because you have purchased something rather than made a donation.

Tax rate reduction for small business

Small business is still a vote winner with the Government and Opposition teaming up to accelerate tax cuts for the sector by 5 years impacting on an estimated 3.3 million businesses.

Parliament recently passed legislation to accelerate the corporate tax rate reduction for corporate tax entities that are base rate entities (BREs). Under the new rules:

  • A 26% rate will apply to BREs for the year ending 30 June 2021, and
  • A 25% rate will apply to BREs from 1 July 2021.

The amending legislation also increased the small business income tax offset rate to 13% of an eligible individual’s basic income tax liability that relates to their total net small business income for the 2020-21 income year and 16% for the 2021-22 income year onwards.

The problem for franking credits

The company tax rate changes have also impacted on the maximum franking credit rules.

In 2015-16, the first year small business entities could access a reduced company tax rate of 28.5%, the maximum franking credit rate for franked dividends remained at 30%. However, from the 2016-17 income year onwards the maximum franking credit rate needs to be determined on a year-by-year basis. In many cases this means that if the company’s tax rate is 27.5% then the maximum franking rate will also be 27.5%. However, this will not always be the case.

Quote of the month

“Live as if you were to die tomorrow. Learn as if you were to live forever.”

Mahatma Gandhi

Level One Spotlight – CSL

Spotlight on CSL

Many of our clients will already be familiar with CSL. CSL is a global healthcare company and it’s a stock that has been included in the majority of our portfolios over the past few years. CSL’s core focus is on rare and serious diseases and influenza vaccines.

CSL Company History

CSL formerly known as The Commonwealth Serum Laboratories was established in Australia in 1916 to service the health needs of a nation isolated by war. Over the ensuing years, CSL provided Australians with rapid access to 20th century medical advances, including insulin and penicillin, and vaccines against influenza, polio and other infectious diseases. CSL Limited was incorporated in 1991 and listed on the Australian Securities Exchange (ASX) in 1994.

CSL’s businesses include:

  • CSL Behring – is a global biotechnology leader with the broadest range of quality medicines in the industry and substantial markets throughout the world. Their therapies are indicated for bleeding disorders, immunodeficiencies, hereditary angioedema, neurological disorders and Alpha-1 Antitrypsin Deficiency.
  • CSL Plasma – A subsidiary of CSL Behring, CSL Plasma is the largest collector of human blood plasma in the world, sourcing plasma from hundreds of thousands of donors globally to produce a range of life-saving medicines for critically ill patients.
  • Seqirus – is one of the largest influenza vaccine companies in the world and a major partner in the prevention and control of influenza globally. It is a transcontinental partner in pandemic preparedness and response, and a leading supplier of influenza vaccines to global markets for both northern and southern hemisphere seasons.

CSL Stock Performance

CSL has provided some outstanding results for shareholders and is up 40% over the last twelve months. This strong return isn’t a one off as demonstrated in the below 10 year price graph.

If you were lucky enough to acquire CSL back at the start of 2008 (pre Global Financial Crisis) at $36.50 you would be sitting on a 352% return with the shares now sitting around $165.

To put this into perspective, if you purchased $10,000 worth of CSL shares 10 years ago your holding would now be worth just over $45,000.

CSL as Part of an Investment Portfolio

CSL is classified as a ‘growth’ stock within our portfolios, with CSL paying a modest dividend currently around 1.18% per annum. Due to the nature of their company, revenue is reinvested back into the business for research and development, as well as acquisitions.

Sometimes low income yields turn clients off stocks, but this is a perfect example of why you should aim for a diversified investment portfolio that focuses on a combination of both growth and income stocks.

Level One Financial Planning offers investment services both personally and within the superannuation environment. Our portfolios invest in listed Australian shares such as CSL. If you are interested in reviewing your current situation or exploring this further, please contact our office on 02 4227 6744 or .

Quarterly Review April 2018

Share Market Update

The ASX200 has started 2018 with a negative quarter declining from 6,065.30 at 31 December 2017 to 5,759.40 at 31 March 2018, which represents a drop of 305.9 points or -5.04%.

This is the worst performance for a quarter since the GFC. Investors have only suffered two worse March quarters over the past 25 years – a 15% plunge in 2008 and a 6.3% loss in 1994.

This effectively neutralised the previous strong October to December 2017 quarter returns which saw the market jump 5.06% and push through the 6,000 point barrier for the first time in almost 10 years.

The heavyweight big four lenders have dragged on the overall market as the stocks wilt under the pressure of a royal commission into the sector. Losses for the quarter stretched to -8.8% for Westpac, while NAB was the best performer but still fell -3.8%.

Telstra has also been a major drag on the ASX in 2018. The big telco has slumped by more than 10% the first three months of the year amid worries its prized dividend is unsustainable.

We have been through a peculiar time in recent years when interest rates have been unbelievably low, deflation has been a key risk, rising inflation was sought after, wage rises were scarce and most stock markets have rocketed along, thanks to central banks throwing money at our economic problems.

Now central banks are going to try to avoid an economic and stock market slump by managing inflation. They need to do this because all their past stimulous activities are working well enough to not only create jobs but now wage rises are starting to happen in the US; hence the threat of inflation has started to spook financial markets. If the inflation levels spike too quickly, then the Fed will have to raise interest rates quickly and that could hurt the positive outlook for US economic growth. This is what spooked the market and caused share markets to fall in early February.

Other overseas developments didn’t help the market either. Threats of a trade war initiated by US President Donald Trump and continued unrest in Syria also depressed share markets around the world.

While this may all look like doom and gloom there are a lot of positives that will drive the market. Market corrections are normal and they can often be more than 10% per cent – and so far, we are only down 6% in Australia from the January high – but deep bear markets (downturns) are normally associated with a recession in the Australia or US, and at the moment there’s no sign of that.

The Australian share market underwent reporting season in February and March which was overall positive with a broad improvement in corporate profits, with around three quarters of companies reporting an increase in earnings versus a year ago. That was the strongest performance since before the GFC.

Solid earnings growth in Australia and abroad will help share markets resume their upwards trend. 2018 will be a year of volatility, but overall should be positive for stocks.

Economic Update

The first quarter of the new year saw the Reserve Bank of Australia (RBA) again keep rates on hold, signalling that the “accommodative monetary policy is still necessary to support our economy”. The Board continues to flag that it will likely be some time before we see an acceleration of wage growth – real wages rose a modest 0.2% in the December quarter – and subdued household spending is still the biggest hurdle.

The US Fed however has continued to increase its rates and indicated that four rate rises could be expected in 2018, rather than the previously stated three, which would see their cash rate overtake ours for the first time since the 1990’s.

Our GDP is expected to continue to be sluggish, with a forecast growth of 2.5% this year and next. At face value, the December quarter GDP numbers were a bit disappointing. Not only did they come in under consensus forecast, but they were lower than the September quarter figures. The annual growth rate of around 2.5% is no better than the average rate recorded over the past 10 years. All of this looks disappointing, particularly given the very low level of interest rates and the economic momentum that appeared to be developing. With non-mining business investment growth firming but consumer spending expected to moderate given softer labour market conditions, the outlook is mixed. Residential construction activity is also expected to continue to decline.

There is optimism in the world economy however and overall the ‘synchronised growth’ phase we are currently in has gained momentum. Tax cuts and additional spending from the US Government has led to an increase in forecast US GDP growth this year, and the latest data suggests the same positive outlook for Europe and Asia. The ‘Trump factor’ and his proposed tariffs on aluminium and steel imports (25% and 10% respectively) continue to present risks to the world economy and cause market shocks, which we experienced in February when the Dow Jones fell 10% on the back of concerns that interest rates would increase earlier than expected. We note that the Dow has since recovered 6% to date.

The RBA also noted that the December quarter numbers were impacted by temporary weakness in exports. More generally, the GDP numbers appear inconsistent with other evidence. Business sentiment is back to the levels last seen at the peak of the pre-GFC good days. Growth in the number of hours worked is more consistent with an economy shifting into top gear. And the (modest) decline in the unemployment rate over the past year points to an economy doing a bit better than average.

So, on balance the economy looks to be doing better but that is still not good enough. The underutilisation rate (the unemployment rate plus those working part-time looking for a full-time job) is still too high indicating that the economy has not run strong enough for long enough. Even taking into account the noise in the data, the economic growth rate in Australia in 2017 was only about mid-table when compared to global peers. Australia has had very strong population growth, boosting the size of the labour force and increasing the demand for houses and infrastructure. But economic growth has only been a little bit faster than population growth. This has resulted in growth of GDP per person being only a bit higher than the pace during the recessions of the 1980s and 1990s.

One of the more positive indicators was the trade balance. After a disappointing end to 2017, the merchandise trade balance bounced back in January, recording a $1 billion surplus. Exports increased by 4% with both goods and services seeing an uptick. A decline in the consumption of goods however saw a 2% decline in imports. Further export growth is expected this year with new Liquid Natural Gas (LNG) capacity set to support this expansion. In contrast, growth in imports is forecast to slow in line with the relatively subdued pace of consumer demand. As a result, the trade balance is expected to remain comfortably in surplus this year and the next.

Following a year when jobs growth was near a record annual high and the unemployment rate declined, it is reasonable to be more confident about our economy. But there are too many people looking for a full-time job, the household debt ratio is too high and wages and productivity growth too low for policy makers and economists to breathe easy just yet. All things considered, we can say that it is good, but could be improved.

Key Trends that will Define the Sydney Housing Landscape in 2018

The Sydney housing market has remained a contentious subject over the past 12 months, with 2017 recording its fair share of ups and downs. Most would agree that residential property has peaked for this cycle and multiple factors are having a negative impact on pricing.

Despite the recent slide in dwelling values across the city, CoreLogic data shows property prices are still 69% higher than they were when the market reached a low point in Feb 2012 and, although interest rates remain low, affordability is still a talking point. So how will the current landscape influence government policy, developer activity and consumer behaviour in Sydney over the coming year?

Investors

Investors are still active in the market, with the latest ABS housing finance data showing they comprise 51% of new mortgage demand; well above the long run average of 37%. This is despite tougher serviceability criteria and mortgage rate premiums.

That said, the share of investor mortgages across New South Wales has fallen from their peak of almost 65% in 2015, and we could possibly see this decline further in light of slow capital gains and low rental yields in Sydney as well as credit restraints on investment and interest only mortgages.

First Homebuyers

On the other hand, first homebuyer activity, as a proportion of all owner occupier finance commitments, rose from 7.5% in early 2017 to almost 15% by the end of last year, indicating a rush from first time buyers to benefit from stamp duty concessions. But despite the increased activity, saving for a deposit is prohibitive for many and this cohort remains a small percentage of all buyers.

To combat this, ‘rentvesting’ – where you rent in your preferred area and buy somewhere more affordable – is likely to become more popular among younger buyers, as is staying at home for longer, or even moving interstate. This already growing trend for domestic migration out of NSW is set to continue as people consider how far their dollar will stretch outside of Sydney.

Government

In contrast, strong overseas migration rates into Sydney are fuelling greater demand for housing. As such, we can expect housing supply to be a priority among government housing policies, including more affordable options.

Taking a long-term view, this is bound to have a greater impact on housing affordability challenges then initiatives such as stamp-duty concessions, which stimulate demand and are likely to simply drive values higher across the more affordable priced areas of the market.

It should be noted that while net overseas migration remains at very high levels, net interstate migration is seeing an increasing number of residents of New South Wales moving to other state and territories.

Developers

Apartment construction has grown to unprecedented levels in recent years, stimulated by demand from local investors and foreign buyers. As these groups are no longer buying at the levels they were, this should influence an easing in high rise unit construction across NSW – mirroring a trend that has been emerging in Victoria and Queensland since late 2016.

Instead, we can expect to see developers shift away from high-rise construction towards medium density options, building town houses and terraces that meet the needs of families. Medium density housing stock located close to the city and along transport spines are currently under supplied and will be highly sought after.

Lenders

While the cash rate isn’t likely to rise this year, mortgage rates could still push a little higher due to increased funding costs on capital markets. Sydney homeowners with several years of property ownership under their belt may have built substantial equity in their home and be able to withstand interest rates moving higher. More recent buyers, particularly those with thinly stretched balance sheets, could find themselves at greater risk of mortgage stress.

However, it could be feasible for lenders to slightly relax their lending policies as APRA limits around credit growth and interest only lending have been comprehensively achieved. If lenders become more willing to lend for investment purposes, ensuring they remain within the regulatory benchmarks, it could help to ease the downward trajectory of Sydney home values.

While there have certainly been some positive outcomes for several players in the Sydney housing market over the past year, enduring challenges remain – particularly around affordability and supply. In a few decades time, this may be less of an issue with technology making it easier for people to live and work outside of the city. But in the short term, tackling these challenges has to remain a priority.

At Level One we believe our economy and property market face some significant challenges going forward including increased banking regulation as a result of the royal commission, restrictions and costs on foreign property buyers, international geo-political uncertainty as well as our own federal election due in the next twelve months. These issues come on the back of the longest and strongest bull run in the property market seen in decades.

Source CoreLogic

Quarterly Review January 2018

Australian Share Market Review

Happy New (Calendar) Year! We hope you all had a great Christmas season.

The December quarter saw the ASX200 finally break through the 6,000 point barrier. The last time the market closed above 6,000 points was in January of 2008, almost 10 years ago!

The ASX200 started the 2017 calendar year at 5,773 points and has closed the December quarter at 6,065.30 points. This is a gain of 292.3 points or 5.06% over the twelve month period. The gains all occurred during the second half of the year with the ASX200 jumping 6% since 1 July 2017.

Out of favour sectors including Resources, Energy and Retail are all providing strong performance. BHP’s share price jumped from $25.78 to $29.57 or 14.7% for the three month period 1 October 2017 – 31 December 2017. Rio Tinto jumped from $66.53 to $75.81 (13.95%) and Harvey Norman’s share price jumped from $3.88 to $4.17 (7.47%) for the quarter.

Financials have proved to be the biggest negative on the market with speculation around the banking enquiry continuing to drag the market down. The announcement of a Bank Levy also weighed heavily on the market when announced in the Federal Budget in May as demonstrated in the below graph.

USA Share Market

Australia’s gains were modest however, compared to the US Dow Jones Industrial Average Index which soared throughout 2017, growing 24.39% for the year.

Love him or hate him, since Donald Trump’s election the US share market’s growth has been spectacular and more can be expected now that his promise of massive tax reform proposals has been passed. US corporate tax rates are to be cut from 35% to 21% as well as tax cuts at the personal level. These new tax concessions more than offset any concerns about US interest rates nudging upwards after three interest rate increases by the Fed in 2017, with the third increase coming in December and more US interest rate rises expected in 2018.

The tax cuts in America should prove positive for the Australian share market with many companies that we invest in (such as CSL, Aristocrat, Macquarie and Boral) deriving income from the US.

Industry Sector Weight Comparison

We have included below a graph detailing the Industry Sector weights for Australia and the USA.

As demonstrated below, the makeup of the stock exchanges are very different with the underperforming financials sector making up over 37% of the Australian Share market.

Economic Update

2017 was a year of slow-and-steady economic growth, growing by 2.8% by the end of the September 2017 quarter. The December quarter results are yet to be released, however consensus expects the quarter to achieve growth of around 0.6%.

A steady increase in business investment throughout 2017, rising 7.7% for the year, is the best outcome and spending from the public sector has helped this growth. All indicators suggest that positive business investment will continue for the next 2 years, albeit with quarter-on-quarter volatility, as conditions continue to improve.

The employment rate at the end of November 2017 was 5.4% – a 56-month low. The labour force participation rate also rose to 65.5%, exceeding expectations by 0.4%.

Although businesses are spending more and the unemployment rate continues to fall, this is not translating to higher household incomes just yet. For the September 2017 quarter, consumer spending rose insignificantly by 0.1% – the worst result since 2008. Wage growth is near record lows, despite the minimum wage getting a boost in July 2017. To add insult to injury, economists are pessimistic on the outlook for any significant upturn in wages in the near future. Nonetheless, all industries to the end of September 2017 saw wages growing ahead of inflation which is also at historically very low levels.

The cash rate was kept on hold for the entire year at 1.50%, although banks started to raise their interest rates during 2017 independent of the Reserve Bank of Australia (RBA) decisions. The RBA are still very, very cautious to raise rates whilst wage growth is low and household debt is high and property prices coming off. We expect the cash rate to remain on hold for some time yet.

Looking ahead, our economy is expected to continue to grow and improve into 2018. The uncertainty households carry about wages and increasing debts will continue to be a headwind. Conversely, continued business investment, government spending and, as a result, a declining unemployment rate should see continued growth.

The RBA released the below infographic on 6 December 2017 which illustrated the current composition of our economy.

Property Market Update

National Dwelling Values fell 0.3% In December, setting the scene for softer housing conditions in 2018.

The transition towards weaker housing market conditions has been clear, but gradual, and is likely to continue throughout 2018.

From a macro perspective, late 2016 marked a peak in the pace of capital gains across Australia with national dwelling values rising at the rolling quarterly pace of 3.7% over the three months to November. Nationally, dwelling values were 4.2% higher over the 2017 calendar year which is a slower pace of growth relative to 2016 when national dwelling values rose 5.8% and in 2015 when values nationally were 9.2% higher.

While property values increased over the 2017 calendar year we saw growth rates and transactional activity gradually lose steam, with national month-on-month capital gains slowing to 0% in October and November before turning negative in December.

According to CoreLogic, the 0.3% fall in December was the catalyst for dragging the quarterly capital gains result into negative territory for the first time since the three months ending April 2016.

Across Australia, the shift to falling national dwelling values is being driven by the capital cities, with the combined capitals tracking half a percent lower over the December quarter, while across the combined regional areas of Australia, values were half a percent higher over the quarter.

Amongst the capitals, the weakest conditions are concentrated in Sydney and Darwin.

Sydney’s housing market has become the most significant drag on the headline growth figures. Sydney dwelling values were down 0.9% over the month to be 2.1% lower over the December quarter and 2.2% lower relative to their August 2017 peak. The city’s annual rate of growth is now tracking at just 3.1%; a stark difference to the recent cyclical peak when values were rising at the annual rate of 17.1% only seven months ago. Despite the reversal in growth rates since August 2017, Sydney dwelling values remain 70.8% higher than their cyclical low point in February 2012.

Source RP Data & BIS Shrapnel

Federal Budget 2018

Overview

On Tuesday, 8 May 2018, Treasurer Scott Morrison handed down the 2018-19 Federal Budget, his 3rd Budget.

In what is widely perceived to be an election Budget (and certainly the last full Budget before the next Federal election), in his Budget speech, the Treasurer said that, in 2017-18, the Budget deficit will be $18.2 billion, less than half what it was 2 years ago. The deficit will fall again to $14.5 billion in 2018-19, Mr Morrison said. According to the Treasurer, the Budget is forecast to return to a modest balance of $2.2 billion in 2019-20 (a year ahead of what was previously expected) and increase to projected surpluses of $11.0 billion in 2020-21 and $16.6 billion in 2021-22.

In the lead up to the Budget, the Treasurer had said the Budget needed to “exercise the restraint that has been so important in ensuring that we bring that Budget back to balance”.

A summary of the key points from the budget are summarised below.

Individuals

Bracket Adjustment in Personal Income Taxes – The upper threshold for the 32.5% marginal tax rate bracket will increase from $87,000 to $90,000. This will affect individuals with a taxable income over $87,000 and will apply from the 2018-2019 financial year.

This has been implemented to address the issue of bracket creep. It’s anticipated that the adjustment to the marginal tax bracket will stop a further 200,000 Australians from entering the 37% marginal tax rate bracket.

Moreover, from 1 July 2022, there will be further adjustments made to the brackets. The upper income threshold for the 32.5% per cent bracket will be increased from $90,000 to $120,000. In addition, the upper income threshold for the 19% rate will increase from $37,000 to $41,000.

Further proposed changes from 1 July 2024 see the 37% tax bracket will be removed entirely. The top threshold of 32.5% per cent personal income tax bracket will be increased from $120,000 to $200,000. Taxpayers will pay the top marginal tax rate of 45% from taxable incomes exceeding $200,000 and the 32.5 per cent tax bracket will apply to taxable incomes of $41,001 to $200,000.

Low and Middle Income Tax Offset – Introduction of a non-refundable tax offset of up to $530 per annum targeted at low to middle income earners. This will affect Individuals with a taxable income of up to $125,333 and will apply from 2018-19 to 2021-22.

For taxpayers with a taxable income of $37,000 or less, the Low and Middle Income Tax Offset will provide a benefit of up to $200.

Between taxable income of $37,000 and $48,000, the value of the offset will increase by 3 cents in the dollar up to the maximum offset of $530.

Taxpayers with taxable incomes between $48,000 and $90,000 will be eligible to receive the $530 maximum offset.

The offset will phase out at a rate of 1.5 cents per dollar between taxable income $90,001 and $125,333.

Medicare Levy – An increase in the Medicare levy low-income thresholds for singles, families, and seniors and pensioners. This will benefit low-income earners and apply from 2017-2018.

In addition, the Government has confirmed that it will not be increasing the Medicare Levy rate from 2% to 2.5%.

Taxation of Testamentary Trusts

From 1 July 2019, the concessional tax rates available for minors receiving income from testamentary trusts will be limited to income derived from assets that are transferred from the deceased estate or the proceeds of the disposal or investment of those assets.

Income received by minors from testamentary trusts is currently taxed at normal adult tax rates rather than the higher tax rates that normally apply to minors. However, some taxpayers have benefited from the lower tax rates from assets unrelated to the deceased estate that have been injected into the trust.

This measure will clarify that adult marginal tax rates will only apply to minors in respect of testamentary trust income generated from assets of the deceased estate (or the proceeds of the disposal or investment of those assets).

Business

$20,000 Instant Asset Write-Off Extended – The availability of the small business $20,000 instant asset write-off has been extended for a further 12 months to 30 June 2019.

Small businesses will be able to immediately deduct purchases of eligible assets costing less than $20,000 first used or installed ready for use by 30 June 2019. Further, the small business simplified depreciation pool can also be immediately deducted if the balance is less than $20,000 over this period.

Better Targeting the R&D Tax Incentive

For companies with aggregated annual turnover of $20 million or more, the Government will introduce an R&D premium that ties the rates of the non-refundable R&D tax offset to the incremental intensity of R&D expenditure as a proportion of total expenditure for the year.

The maximum amount of R&D expenditure eligible for concessional R&D tax offsets, will be increased from $100 million to $150 million per annum.

For companies with aggregated annual turnover below $20 million, the refundable R&D offset will be a premium of 13.5 percentage points above a claimant’s company tax rate.

Cash refunds from the refundable R&D tax offset will be capped at $4 million per annum. R&D tax offsets that cannot be refunded will be carried forward as non-refundable tax offsets to future income years.

Cash Payment Limit – The Government will introduce a limit of $10,000 for cash payments made to businesses for goods and services. It is proposed that the said measure would apply from 1 July 2019.

Currently, large undocumented cash payments can be used to avoid tax or to launder money from criminal activity. This measure will require transactions over a threshold to be made through an electronic payment system or cheque.

Removing Tax Deductibility of Non-Compliant Payments – A Tax deduction would not be allowed for the following where PAYG is not withheld:

  • Wages;
  • Payments made by businesses to contractors where the contractor does not provide an ABN.

PAYG reporting and tax withholding requirements provide integrity to the tax system. The Black Economy Taskforce recommended this action to create a further financial disincentive for businesses to engage in black economy behaviour and ensure greater compliance with tax obligations.

Targeted Amendments to Division 7A – The start date of the measures to make targeted amendments to Division 7A announced in the 2016-2017 has been deferred to 1 July 2019.

Application of Division 7A to Unpaid Present Entitlements – From 1 July 2019, the Government is proposing to tighten the rules regarding the application of the provisions of Division 7A to an unpaid present entitlement of a private company. This measure will ensure the unpaid present entitlement is either required to be repaid to the private company over time as a complying loan or subject to tax as a dividend.

Recovery of Tax and Superannuation Debts – The Government will provide $133.7 million to the ATO to continue to deliver on a range of strategies that sustain both an increase in debt collections and an improvement in the timeliness of debt collections. The measure will ensure the ATO is able to continue to target those taxpayers gaining an unfair financial advantage over those who pay their fair share of tax and superannuation.

Superannuation

Voluntary Contributions to Super Funds – From 1 July 2019, an exemption is proposed to be introduced from the work test for voluntary contributions to superannuation, for people aged 65-74 with superannuation balances below $300,000, in the first year that they do not meet the work test requirements.

Maximum Number of Super Members – From 1 July 2019, the maximum number of allowable members in new and existing self-managed superannuation funds and small APRA funds is proposed to be increased from four to six.

Three Yearly Audit Cycle for SMSF – Also from 1 July 2019, the annual audit requirement is proposed to be changed to a three-yearly requirement for self-managed superannuation funds (SMSFs) with a history of good record-keeping and compliance.

Capping Passive Fees for Low Balance Super Funds – From 1 July 2019 the government will introduce a 1.5% per cent semi-annual cap on administration and investment fees charged by superannuation funds on accounts with balances below $6,000.

Social Security

Pension Work Bonus – From 1 July 2019, the Pension Work Bonus will increase from $250 to $300 per fortnight with the maximum unused amount that can be accrued increasing to $7,800 (up from $6,500).

In addition, the Government will extend the Pension Work Bonus to those who are self-employed. However, a ‘personal exertion’ test will be introduced to ensure the Pension Work Bonus is only available to those who are engaged in gainful work and not to those receiving passive income such as income from real estate.

Expanding the Pension Loan Scheme – From 1 July 2019, the Government will expand eligibility to the Pension Loan Scheme to include all Australians of Age Pension age. The Government will also increase the loan amount so that an individual can receive a fortnightly amount up to 150% of the maximum Age Pension rate.

Currently part-pensioners and some self-funded retirees who own a property in Australia can access the non-taxable Pension Loan Scheme. It is available to those who are not entitled to the maximum rate of pension, or any pension, because of the Income Test or Assets Test (but not if they are ineligible under both tests).

Under the scheme, individuals who are Age Pension age can obtain a loan (secured against the individual’s property) to increase their fortnightly pension payment from a part-rate or nil rate, up to the maximum pension rate.

Other existing rules including age-based loan to value ratio limits, ability to repay the loan at any time or on the sale of the property and fortnightly compounding of interest at a rate of 5.25% will continue to apply.

Income Test for Carer Allowance – From 20 September 2018 the Government will introduce a $250,000 annual Income Test threshold for the Carer Allowance and Carer Allowance (child) Health Care Card.

Currently, individuals who are providing care and attention to someone who has a disability or is frail with age can be eligible for:

  • a non-means tested Carer Allowance of $127.10 per fortnight and a Health Care Card if care is provided to someone who is aged 16 or older or a child under age 16 with higher needs;
  • a Health Care Card only if care is provided to a child under age 16 with lower needs.

Spending Incentives

Energy Bills – The government has pledged $41.5 million over seven years to ensure secure, reliable and affordable energy. The National Energy Security Board estimates yearly power bills will be slashed by $400 for the average Aussie household from 2020 under the government’s national energy guarantee.

Preschool and Childcare – From 2 July 2018, families with a combined income of $187,000 or less, will no longer have a limit on the Child Care Subsidy.

Hospitals – The government is touting “record levels” of public hospital funding, including a public hospital agreement that will deliver more than $30 billion in extra funding between 2020-21 and 2024-25.

The Medicare Guarantee Fund will receive $34.4 billion and a new program to encourage doctors to move to regional areas will be introduced.

Schools – Schools are big winners this year, with needs-based funding to deliver an extra $24.5 billion over the next decade. That’s 50% more funding per student on average. The government will also support businessman David Gonski’s recommended curriculum reforms and new online learning tools. The National Schools Chaplaincy program will win permanent funding, including an extra $247 million over four years, and will develop a focus on anti-bullying.

Infrastructure – The Treasurer has announced a $1 billion Urban Congestion Fund, designed to fund state-level projects that improve traffic flow.

In NSW, the government has promised $400 million to duplicate the Port Botany freight rail line, taking up to 900 trucks off the congested roads each day.

The Treasurer announced $971 million in federal funding for the Coffs Harbour bypass, which will enable drivers to avoid 12 sets of traffic lights on that increasingly busy stretch of road and a new, four-lane bridge will be built over the Shoalhaven River at Nowra.

Environment – The government is investing more than $500 million in the Great Barrier Reef to improve water quality, combat the coral-destroying crown-of-thorns starfish and conduct scientific research.

Job’s Incentive – An additional $250 million will go towards the Skilling Australians Fund to support growth in apprenticeships and traineeships. An extra $89 million will create more than 40,000 Transition to Work places to support youths aged 15 to 21 at risk of long-term unemployment.

An additional $8.3 million will go towards helping veterans find civilian employment, while the Brotherhood of St Laurence will receive $700,000 to establish a Youth Employment Body to create “best-practice youth employment service models”.

Law and Order – The government has splashed out to hunt down criminals, terrorists and paedophiles. More than $37 million has been pledged for the Australian Federal Police, the Australian Criminal Intelligence Commission and the Australian Security Intelligence Organisation, $68.6 million to establish the Australian Centre to Counter Child Exploitation, and $59.1 million to establish the National Criminal Intelligence System, a national database for use by police and intelligence agencies.

National Security – The government is investing $293.6 million in aviation security to safeguard Australia against “evolving threats” in civil aviation. This will include $50.1 million to enhance security at 64 regional airports with new and upgraded screening technologies.

It will also spend $121.6 million to enhance screening of air cargo and international mail.

The government is also providing $62.2 million to deter people smuggling.

To tackle the increasing threat of cyber crime and terrorism, the government is also providing $130 million to identify threats via visa screening.

Quarterly Review July 2018

Share Market Update

The Australian share market has finished the 2018 financial year with a capital gain of 8.26% (before dividends), or up 13.8% including dividends.

The strong performance can be attributed to earnings upgrades from the resources sector and a strong performance from the high-growth market darlings including CSL, Macquarie & Aristocrat.

CSL, which has broken the $200 share price level in the last few days, has been one of the biggest anchors of the market’s performance. BHP Billiton is the single biggest contributor to the index’s advance, followed by CSL and Macquarie Group.

Telstra, Commonwealth Bank and AMP were the largest detractors. Telstra has dropped 39% of its value over the last twelve months and the banking index is down 7%.

Bank stocks have found support this quarter but have not recovered this year’s losses. The Royal Commission has fuelled the view that banks will tighten the availability of credit in the economy, which removes a source of support for house prices.

The Australian share market is now sitting around 6,200 points and is at 10 years highs. However, we are still sitting below pre GFC highs from November 2007 of 6,873.20.

Australian Share Market Movement

Economic Update

June marked 21 months of the cash rate being kept on hold by the Reserve Bank of Australia (RBA). The Board continues to keep their existing stance on monetary policy until their measures see “further progress in reducing unemployment and having inflation return to target”. Interestingly, the Board removed it is “more likely that the next move in the cash rate would be up, rather than down” from its June minutes, which caused economists to question the RBA’s intentions.

On the other hand, the lenders have continued to increase their mortgage rates despite the RBA. We have also seen term deposit rates move upward over recent times also.

The primary reason for both the RBA being on hold and the banks upping their rates is housing. The household debt-to-income ratio has soared to a record high of 190% in the first quarter of 2018. This high level of debt makes the RBA nervous, particularly when wage growth has been sluggish and interest rates are at historic lows.

ASIC APRA and the Royal Commission has been putting pressure on lenders to tighten lending criteria. The slowdown in demand had started to occur in early 2018 after house prices peaked in late 2017 but the Royal Commission, which commenced in March, has seemingly exacerbated the slowing of the housing market.

Home loans are the key leading indicator being watched for signs of a ‘credit crunch’. Loan growth is forecast to fall by around 20% with the banks continuing to tighten lending. House prices are expected to continue to decline, with the actual percentage being anyone’s guess.

All of these factors will likely see the RBA on hold until mid-2019 or into 2020.

Recent GDP numbers indicated that the economy was doing better than average, consistent with very strong levels of business sentiment. This is partly reflected in the strong global economy. There is strong demand for commodities, including iron ore, coal and gas. Tourism is very strong and overseas students attending Australian universities (and schools) are on the rise. Infrastructure spending is booming, most notably on the East Coast. Population growth is still relatively strong. Firms are again spending more on Capex.

More good news is that high business confidence has led to stronger jobs growth over the past 12 to 24 months. This has reduced consumer fears of unemployment. The RBA noted that job vacancy levels are high, and other indicators point to ongoing strong employment growth. Overall, consumers acknowledge that the economic outlook is improving. Despite this, households indicate that the state of their personal finances is only ‘OK’, a reflection of the very modest growth in their disposable incomes over recent years.

The outcome of this is that people are using more of their incomes for cost of living, they are saving less, and if there is spare cash, it is being used to pay down debt, rather than used for retail spending. Therefore, wage growth in a stronger labour market is a key element of continued economic stimulus. The RBA is confident this will occur but will take some time yet.

The Aussie dollar is expected to lower again to around US$0.72 to US$0.73 by the end of the calendar year. This will also improve economic conditions domestically, in the face of increased risks globally.

Property Market Update 2017-18 Financial Year In Review

In this update we delve into how national housing markets have performed in terms of value growth in the 2017-18 financial year and how it stacks up against previous years.

The first chart highlights the change in dwelling values nationally across each financial year from 1997-98 to 2017-18. In the most recent financial year, dwelling values fell by -0.8% which was the largest fall in values over a financial year since 2011-12 (-3.0%). The fall in values over the year was a significant contrast to the 10.2% increase in values over the 2016-17 financial year.

National Market Performance

Dwelling values fell by -1.6% over the 2017-18 financial year across the combined capital cities. This represented the largest fall since 2011-12 (-3.0%) and it was a substantial slowdown compared to the 11.1% increase in values over the 2016-17 financial year. Last financial year was one of only four financial years over the past two decades in which capital city values have fallen.

Although combined regional market dwelling values increased by 2.2% over the 2017-18 financial year, the rate of growth was much slower than the 6.4% the previous year. Regional dwelling value growth last year was the slowest it has been since 2012-13 when values increased by just 0.9%. Regional markets have only seen three years out of the past 20 in which values have fallen over the financial year.

Sydney dwelling values fell by -4.5% over the 2017-18 financial year which was their largest financial year fall in over 20 years. In fact, looking at data which goes back to 1980-81 financial year, this is the weakest financial year for growth in Sydney dwelling values over that period. The slowdown in Sydney dwelling value growth is stark when considering that a year earlier values had increased by 16.4% over the financial year.

Dwelling values were 3.2% higher over the 2017-18 financial year in regional NSW. Like Sydney, there has been a significant slowdown in growth over the year compared to the 11.9% increase the previous year. In fact, the 3.2% increase was the slowest financial year growth since 2012-13.

Over the 2017-18 financial year, Melbourne dwelling values increased by 1.0%. Although values rose for the sixth consecutive financial year, it was the slowest rate of growth out of any of those six years and well down on the 13.0% increase over the 2016-17 financial year.

Growth in Brisbane dwelling values has slowed over each of the past two financial years with an increase of 1.1% in 2017-18. The change in values over the most recent financial year is the lowest since values fell by -3.6% over the 2011-12 financial year. Although the rate of value growth slowed, values have increased over each of the past six financial years.

Adelaide dwelling values increased by 1.1% over the 2017-18 financial year, marking the 5th consecutive year in which values have increased. Although values increased over the year, it was the slowest rate of change for the city since values fell -0.4% in 2012-13.

Perth dwelling values fell by -2.1% in 2017-18 which represented a slowing of value declines from the -2.6% fall in 2016-17. Although values have now fallen for four consecutive financial years, declines over the most recent year were the most moderate of those four years.

Hobart dwelling values increased by 12.7% over the 2017-18 financial year which was marginally lower than the 12.8% over the previous financial year. Dwelling values in Hobart have now increased for five consecutive financial years however, the past two years have seen the strongest growth since 2003-04.

For the fifth consecutive financial year, dwelling values in Darwin have fallen, down -7.7%. The rate of value decline over the past financial year was much greater than the -2.6% in 2016-17 however, it was slightly lower than the -8.0% decline in 2015-16.

Across most regions of the country, dwelling value growth over the 2017-2018 financial year slowed compared to the previous year. Unlike previous downturns, the slowing of value growth was not precipitated through movements in the cash rate. Independent increases to the cost of borrowing, particularly for investors, tighter credit conditions and a lack of real wage growth which has led to reduced affordability are some of the main drivers of the weakening housing conditions.

Looking forward to the 2018-19 financial year, the factors which contributed to the slowing growth in 2017-18 seem unlikely to be removed over the coming financial year which may result in even weaker value changes over the coming year.

Level One Outlook

Looking forward we at Level One keep a keen eye on offshore developments. Importantly a strong US economy coupled with strong US jobs growth should continue to see US interest rates rising going forward (they have risen seven times since December 2015).

This will place significant pressure on our domestic cost of funds which will drive our interest rates higher despite the RBA holding the cash rate on hold at 1.5%. This is already happening as local banks slowly lift rates. Make no mistake – there is more to come and this will obviously have a direct effect on property prices into the future.

End of Financial Year Superannuation Strategies

Superannuation Contribution Caps

There are limits to the amount you can contribute into superannuation per year. These caps for the 2018 financial year are:

  • Non-Concessional Contribution Cap – $100,000
  • Concessional Contribution Cap – $25,000 for all ages

Non-concessional contributions are after-tax contributions including spouse contributions and contributions made under the Super Co-Contribution Scheme. Non-concessional contributions were previously known as undeducted contributions.

Concessional contributions are before-tax contributions and include your employer’s compulsory contributions, additional employer contributions, and any amounts that you salary sacrifice into superannuation or personally claim a tax deduction for.

For persons under age 65, there is the ability to contribute three times the non-concessional contribution cap limit in a single year, provided that you do not make further non-concessional contributions in the following two financial years and have a superannuation balance of less than $1.4 million.

There are penalties if you exceed the superannuation contribution caps. Please contact our financial planning team if you require advice.

Tax Deductions for Personal Superannuation Contributions

From 1 July 2017, individuals eligible to make contributions to superannuation, will be able to claim an income tax deduction for personal superannuation contributions up to the concessional contribution cap of $25,000. Note the $25,000 cap also includes your employer compulsory contributions!

This will apply regardless of employment status.

This is effectively the same as salary sacrificing each pay cycle through your employer.

This strategy could be utilised at the end of each financial year to make a lump sum superannuation contribution from your personal funds if you find yourself under the concessional contribution cap for the year.

This strategy could also be beneficial if a large capital gain is made during a single financial year to reduce your overall tax liability.

As always it is important to ensure your actions are appropriate for your circumstances. Please contact us if you require advice.

Government Co-Contribution – Money for Nothing!

If you meet the following criteria:

  • Your total income is equal to or less than the lower threshold of $36,813 for the 2017/2018 financial year;
  • 10% of your eligible income must come from employment-related activities, carrying on a business, or a combination of both;
  • You were less than 71 years old at the end of the financial year;
  • You lodge a tax return; and
  • You make personal contributions of $1,000 to your super account.

Then you will receive the maximum co-contribution from the Government of $500.

So invest or contribute $1,000 and get $500 that’s a 50% guaranteed return!

If your eligible income is above the lower threshold of $36,813 but below the upper threshold of $51,813 for the 2017/2018 financial year, and you satisfy the above criteria, you will be eligible to a reduced Government Co-Contribution.

We note that contributions must be received and cleared in your superannuation account by 30 June 2018 for this to apply to the 2018 financial year.

Spouse Contributions

Commencing 1 July 2017, the Government has increased access to the low-income spouse tax offset.

This provides up to $540 per annum as a tax offset for the contributing spouse and will apply where the low-income spouse’s assessable income is below $37,000 (increased from the current $10,800).

So if the higher income earner contributed $3,000 into their spouse’s superannuation fund they receive a $540 tax offset or credit on their annual tax return.

This is a great strategy for members of a couple where one spouse is earning a higher income and can make a contribution for their spouse to reduce personal taxation, whilst also increasing retirement funds.

If you are interested in discussing this strategy or your retirement planning in general, please contact our Financial Planning Team.

Business Matters August 2018

ATO blitz on AirBNB and Stayz

The Australian Taxation Office (ATO) has announced a new data-matching program targeting taxpayers earning income from the exploding popularity of short-term rentals available on platforms like AirBNB and Stayz.

Utilising information from online platform sharing sites matched to information from financial institutions, the ATO is targeting 190,000 individuals to make sure they have not failed to declare or under declared rental income or have overclaimed deductions. In effect, whatever data your sharing platform holds on you will need to match what you have declared in your tax return. And yes, the ATO can potentially check what is coming in and out of your bank account.

The ATO states that there is no such thing as a “rental hobby” so even a one-off rental needs to be declared.

New domestic violence leave entitlements

A Fair Work Commission decision created a new entitlement for most Australian employees; unpaid family and domestic violence leave.

The Fair Work decision provides five days’ unpaid leave per annum to all employees (including casuals) experiencing family and domestic violence. The leave will also be available in the event that an employee needs to do something to deal with the impact of the family and domestic violence such as attend court or access police services.

Applying from the first pay period from 1 August 2018, the entitlement covers all employees except some enterprise and State public sector award employees, and Award free employees. The leave does not accumulate from year to year and does not have to be taken all at once.

Employees taking the leave will need to let their employers know as soon as practicable and advise how long they intend to be off work. It’s important that employers that have an employee facing domestic violence manage the issue sensitively and confidentially.

Employers can request evidence of the need for family and domestic violence leave such as documents issued by the police service, documents issued by a court, family violence support service documents, or a statutory declaration.

See the Fair Work Ombudsman’s website, Family & domestic violence leave for more information.

Are you holding back your business?

Overcoming the biggest problems in business often comes down to the simple things. Here are a few simple things you can do to capitalise on your opportunities and reduce your risks.

“I didn’t get time…” No more excuses

Most people simply don’t set aside the time to do the forward planning they know they need to do. Here’s a simple test: write down your goals for the business. Now ask yourself, are you doing something to achieve those goals every day or every week? If not, it’s not a goal. It’s just a nice thought.

Set a realistic budget

Financially mapping your business reduces your risk and removes some of the surprises that can occur. Your budget needs to be realistic – not just a percentage increase on last year.

Start with an operating budget and assess each line critically. Map your revenue to see where, how and when the money is coming in to create a reliable estimate of your income for the coming year. Once you have your revenue expectations in place, look at what is required to generate that income. For example, what advertising, marketing and resources will be required?

Once you are comfortable with your revenue, work up your expenditure budget. Be tough on costs. Don’t forget to allow for growth and the increases that are likely to flow through.

Once your budget is complete and you have a good idea of your likely profit margins, do a couple of alternative estimates for your key revenue drivers so you understand the impact of changes to your assumptions. Once you have all this in place, track and measure it throughout the year. Where possible, your management team should be a part of this process and take responsibility for achieving the budget numbers they give you. When people don’t take the steps that they knew were required to achieve the budget the gaps become obvious fairly quickly. Having a budget in place that you need to report on regularly makes you focus on what really needs to be done.

Map your cash

Even some very large businesses have failed because they ran out of cash. Understanding your cashflow needs is vital particularly for high growth business.

Understanding your cash position is about understanding the timing differences: How long will it take for your customers to pay you? How much stock will you need to hold? And, what are the payment terms required by your suppliers? With your cash flow, don’t forget to allow for things like tax payments, loan repayments, dividends and any capital purchases that are planned. These can be ‘big ticket’ items and if you don’t allow for them then you will get caught out.

As part of your cash flow forecast identify your capital expenditure requirements. Don’t deal with these on a one-off basis as they arise, plan them in advance.

Expect the unexpected

Growing to death is often the result of unplanned growth opportunities. It’s ironic that seizing a major sales contract or big new client can be your business’s ruin but its more common than you think.

Many business operators are very good at what they do. Most have an excellent knowledge of the business they conduct and understand their products and services. Most also have an in-depth knowledge of sales performance and revenue. Few however, have a high level of financial management expertise, so when a big new opportunity presents, critical financial questions are not part of the vocabulary. As a result, there can be a sudden and unintended impact on their financial position. A rush of sales might be a great thing but it is not always counterbalanced by a rush of income and profit. Free cash and liquidity are the victims.

Take all the tax advantages you can

For small business in particular there are a range of concessions and funding you can access. Many businesses simply don’t realise the opportunities available to them.

A simple example is trading stock valuations. Your trading stock is an asset that is recorded on your balance sheet. In most cases it should be tax neutral to you. The cost of purchasing stock is expensed in your profit and loss account and offset by the value of the stock asset, until you sell it. While the amount of stock you are carrying will impact on your cash position, because you have your funds tied up in it, there is no direct impact on your profits or taxable income until you sell that stock. However, if at 30 June some of your stock is worth less than its cost price, you have the option to value it at the lower figure and take the tax write off now, rather than wait until the stock is sold. This reduction in your stock value will produce a tax saving for you.

Another way businesses disadvantage themselves is not taking the Government concessions available to them. The R&D tax incentive and Export Market Development Grant are a classic case. In the case of R&D incentives, if you develop new technologies or products, you might be eligible for a 43.5% tax offset (if your business has a turnover under $20 million). The Export Market Development Grant reimburses up to 50% of eligible export promotion expenses above $5,000 provided that the total expenses are at least $15,000.

Quote of the month

“If your house is burning, wouldn’t you try and put out the fire?”

Imran Khan, former cricketer and Pakistan’s incoming Prime Minister.

Business Matters July 2018

Company tax change in limbo

An issue that many business owners and investors will need to grapple with is uncertainty on the tax rate that applies to companies for the year ended 30 June 2018 and the maximum franking rate on dividends paid during the 2018 income year.

While the Government introduced a Bill to Parliament back in October 2017 which seeks to change the rules in this area, the Bill is still not yet law. As a result, it looks like we will need to apply the existing provisions for determining company tax rates and maximum franking rates (which are based on whether the company carries on a business), but also to be aware that the position might change if and when the Bill passes through Parliament.

Under current rules, a company would be subject to a 27.5% tax rate if it carries on a business (which could include investment activities as long as there is a genuine expectation of making a profit) and the aggregated turnover of the company and certain related parties is less than $25m.

If the Bill passes in its current form then the tax rate and maximum franking rate position will depend on whether more than 80% of the company’s income is passive in nature (e.g., interest, rent etc.). If more than 80% of the company’s income is passive in nature, then a 30% tax rate should apply. The $25m aggregated turnover test will also need to be applied.

July 2018 personal income tax cuts

New personal income tax rates come into effect from 1 July 2018. The top threshold of the 32.5% personal income tax bracket will increase from $87,000 to $90,000. Dovetailing into the tax bracket change is the introduction of the Low and Middle Income Tax Offset for those with taxable incomes up to $125,333. The offset is a non-refundable tax offset that you receive when you lodge your income tax return.

If your annual taxable income is $80,000 in 2018-19, then the personal income tax changes provide an annual tax reduction of $530 per year. If your annual taxable income is $120,000, then the changes give you an annual reduction of $215.

New minimum pay rates from 1 July 2018

New award wages and allowances come into effect from 1 July 2018. If you’re an employer, it’s important that you are aware of the new rates and apply them. The Fair Work Ombudsman’s online Pay Calculator can help you determine the right rates to apply.

When can you take your super?

The cash sitting in your superannuation fund can be tempting, particularly if you are short of cash. But, the reality is there are very few ways you can take advantage of your superannuation once it has been contributed to the fund – even if you change your mind.

The sole purpose test underpins access to your superannuation – that is, superannuation is for the sole purpose of providing retirement benefits to fund members, or to their dependants if a member dies before retirement. It’s important to keep this in mind because it’s often forgotten when people are tempted by ‘too good to be true’ schemes to access their super early.

The ATO recently warned against a scheme spreading through suburban Australia where scammers encourage people to access their superannuation early to pay debts, take a holiday, or provide money to family overseas in need. All the scammers need is a fee for their services and you to sign blank forms and provide identity documentation. Typically, the forms are used to roll-over your super from an industry fund, establish an SMSF, and open a bank account for the new SMSF. Once the superannuation is rolled into the SMSF, the funds are accessible to withdraw. Problem is, accessing the superannuation is illegal unless you meet the conditions. Any super that is withdrawn early is taxed at your marginal tax rate even if the money is returned to your fund later, plus you are disqualified from being a trustee of your SMSF. If you knowingly allow super benefits to be accessed illegally from your fund, penalties of up to $1.1 million and a jail term of 5 years can apply.

Generally, you can only access your super once you turn 65, when you reach preservation age and retire, or reach preservation age and choose to keep working and start a transition to retirement pension. Currently, the preservation age is 55 years old for those born before 1 July 1960. It then increases by one year, every year, up to the maximum of 60 for those born after 30 June 1964. There are some very limited circumstances where you can legally access your super early.

Treasury is in the midst of a review into the early release of superannuation. The review was sparked by a rapid increase in requests for early access to fund medical treatments such as gastric banding surgery.

“A significant proportion of recent applications appear to relate to out-of-pocket expenses associated with bariatric surgery (that is, weight loss surgery), with a smaller proportion attributable to assisted reproductive treatment (ART), also referred to as in-vitro fertilisation (IVF) treatment.”

The review however is focussed on more than medical treatments, looking at the issue broadly including whether it is appropriate to provide early access to superannuation to pay compensation to victims of crime.

Compassionate grounds

Superannuation benefits can be released on compassionate grounds to meet expenses related to medical treatment, medical transport, modifications necessary for the family home or motor vehicles due to severe disability, and palliative care. Funds may also be released on compassionate grounds to prevent foreclosure of a mortgage or exercise of a power of sale over the fund member’s home (principal place of residence); or to pay for expenses with a dependant’s death, funeral or burial.

Early access to super needs to be a last resort. It’s up to the person applying for early access to prove to the regulator that they don’t have the financial capacity to meet these expenses without access to their superannuation.

In 2016-17, the Department of Human Services received 37,105 applications for early access to superannuation on compassionate grounds, with 21,258 approved. The average amount released was $13,644. The great majority (72%) of funds released were on medical grounds , 18% were released for mortgage payments.

A person seeking early release for medical treatment must provide written evidence from at least two medical practitioners – one of whom must be a specialist – certifying that the treatment or medical transport:

  • is necessary to treat a life threatening illness or injury; or alleviate acute or chronic pain; or alleviate an acute or chronic mental disturbance; and
  • is not readily available to the individual or their dependant through the public health system.

At present, the Department of Human Services will respond to applicants within 28 days. The applicant then must approach their superannuation fund trustee who has ultimate discretion regarding the release of the funds. From 1 July 2018 however, the Australian Taxation Office will take over administration of early release applications, streamlining the process so applicants and superannuation funds receive the compassionate release notice electronically and simultaneously.

First home buyers

The First Home Super Saver Scheme (FHSS) enables first-home buyers to save for a deposit inside their superannuation account, attracting the tax incentives and some of the earnings benefits of superannuation.

Home savers can make voluntary concessional contributions (for example by salary sacrificing) or non-concessional contributions (voluntary after-tax contributions) of $15,000 a year within existing caps, up to a total of $30,000. Mandated employer contributions cannot be withdrawn under this scheme, it is only voluntary contributions made from 1 July 2017 that can be withdrawn.

When you die

Superannuation is not an asset of your estate so your superannuation is provided to your eligible beneficiaries – your spouse (de facto) children or a financial dependant – by the fund trustee.

Putting in place a binding death nomination however will direct your superannuation to whoever you nominate, so long as they are an eligible beneficiary. If you have nominations in place, it is essential that you keep these current. Death benefits are normally paid as a lump sum but in some circumstances can be paid as an income stream.

Just be aware that with the $1.6 million transfer balance cap in place, if your superannuation is paid as a death benefit pension to your nominated beneficiary, this could tip them over the cap. It’s a good idea to get estate planning advice to manage it correctly.

Divorce and super

The Family Law Legislation Amendment (Superannuation) Act 2001 allows superannuation to be split during a divorce either by agreement or by court order.

Before making a superannuation agreement, the parties must receive separate and independent legal advice. The agreement must be in writing and must be endorsed by a qualified legal practitioner.

Where the superannuation is split by order of the family court, the court decides on how the fund is split.

Essentially, the amount of split super is rolled into the other parties superannuation fund. The same rules apply to accessing superannuation. That is, it cannot be accessed until you turn 65 or reach preservation age.

If you and your spouse have an SMSF, you need to continue to manage the fund. Relationship breakdown does not suspend your obligations as trustee.

What happens if you contributed too much?

If you contributed too much superannuation to your fund, you cannot simply withdraw the amount.

If you breached your contribution caps, you can apply to withdraw the amount above your cap from the fund. The excess amount is treated as personal assessable income and taxed at your marginal tax rate plus an excess concessional contributions charge. Withdrawal of the excess amounts should not occur until the ATO provides you with a release authority that then needs to be given to the superannuation fund.

If you did not breach your contribution limit but simply overcommitted to superannuation, you cannot simply withdraw the amount.

Using SMSF assets and funds

In general, the assets of an SMSF cannot be used for the personal use or enjoyment of the fund members (or their associates such as friends or family). For example, if the SMSF owns a holiday home, you cannot use it, if the fund has vintage cars, you cannot drive them, if your fund owns art, you cannot hang the art in your home or your office.

The exception to this is business real property. For example, assuming the trust deed allows for it, business owners can use their SMSF to purchase a building, then lease that building back to their business. Business real property is land and buildings used wholly and exclusively in a business.

$10k limit on cash payments to business

One of the interesting approaches to tackling the black economy in the recent 2018-19 Federal Budget was the announcement of a $10,000 limit on cash payments to business.

Unrecorded and untaxed transactions that occur in the community are estimated at up to 3% of GDP or around $50 billion. We have all seen examples of the black economy in action in the form of cash payments and money not ringing through a retailer’s till. This initiative targets high value transactions that are generally used to avoid tax obligations or for laundering the proceeds of a crime.

How will the new rules work?

The cash payment limit targets larger cash payments – typically made for cars, yachts and other luxury goods, agricultural crops, houses, building renovations and commodities – removing the ability of any individual or business to make a single cash transaction of $10,000 or more.

The limit would apply to all payments made to businesses with an ABN for goods or services. The impending restrictions would not apply to private sales where the seller does not have an ABN, or cash payments to financial institutions.

Transactions at or in excess of the $10,000 threshold would need to be made electronically or by cheque. Splitting the payment into smaller amounts either as cash payments or a combination of cash and electronic payments would not be allowed. There would also be restrictions to prevent payment structuring to get around the payment limit.

At present, only financial services, banks and gambling industries have obligations for cash transactions of $10,000 or more. Under the Anti-Money Laundering and Counter-Terrorism Financing rules, transactions of $10,000 or more must be reported to the Australian Transaction Reports and Analysis Centre (AUSTRAC) within 10 working days.

Australia will not be the first country to introduce cash payment limits; France, Spain and Italy all impose limits at varying levels and generally for much smaller amounts than $10,000. For example, France imposes a EUR 1,000 limit for goods and EUR 450 for certain services. There are some exemptions for non-residents, salaries paid in cash, and for those who do not have access to any other form of payment.

The Australian limit on cash transactions is intended to apply from 1 July 2019. The legislation enabling the measure is currently in consultation phase and is not yet law. We will keep you up to date on progress.

$20k accelerated deductions for small business extended another year

The ability for small business entities to claim an immediate deduction for assets costing less than $20,000 has been extended for another 12 months until 30 June 2019.

From 1 July 2019, the immediate deduction threshold will reduce back to $1,000.

There are no limits to the number of times you can use the immediate deduction assuming your cashflow supports the purchases.

If your business is registered for GST, the cost of the asset needs to be less than $20,000 after the GST credits that can be claimed by the business have been subtracted from the purchase price. If your business is not registered for GST, it is the GST inclusive amount.

Second hand goods are also deductible. However, there are a number of assets that don’t qualify for the instant asset write-off as they have their own set of rules. These include horticultural plants, capital works (building construction costs etc.), assets leased to another party on a depreciating asset lease, etc.

If you purchase assets costing $20,000 or more, the immediate deduction does not apply but small businesses have the ability to allocate the purchase to a pool and depreciate the pool at a rate of 15% in the first year and 30% for each year thereafter.

Quote of the month

“Many of life’s failures are people who did not realize how close they were to success when they gave up.”

Thomas A. Edison

Level One Financial Advisers Pty Ltd. AFSL 280061. The information contained on this website is general information only. You agree that your access to, and use of, this site is subject to these terms and all applicable laws, and is at your own risk. This site and its contents are provided to you on an “as is” basis, the site may contain errors, faults and inaccuracies and may not be complete and current. It does not constitute personal financial or taxation advice. When making an investment decision you need to consider whether this information is appropriate to your financial situation, objectives and needs. Liability limited by a scheme approved under Professional Standards Legislation. Disclaimer and Privacy Policy

Doug Tarrant

Doug Tarrant

Principal B Com (NSW) CA CFP SSA AEPS

About Doug

As founder of the firm Doug has over 30 years of experience advising families, businesses and professionals with commercially driven business, taxation and financial advice.

Doug’s advice covers a wide variety of areas including wealth creation, business growth strategies, taxation, superannuation, property investment and estate planning as well as asset protection.

Doug’s clients span a whole range of industries including Investors; Property and Construction; Medical; Retail and Hospitality; IT and Tourism; Engineering and Contracting.

Doug’s qualifications include:

  • Bachelor of Commerce (Accounting) UNSW
  • Fellow of the Institute of Chartered Accountants
  • Certified Financial Planner
  • Self Managed Superannuation Fund Specialist Adviser (SPAA)
  • Self Managed Superannuation Fund Auditor
  • Accredited Estate Planning Specialist
  • AFSL Licensee
  • Registered Tax Agent
Christine Lapkiw

Christine Lapkiw

Senior Associate B Com (Accounting) M Com (Finance) CA

About Christine

Christine has over 25 years of extensive experience advising clients principally on taxation and superannuation related matters and was a founder of the firm when it began in 2004.

Christine’s breadth and depth of knowledge and experience provides clients with the comfort that their affairs are in good hands.

Christine currently heads up the firm’s SMSF division and oversees a team that provide tailored solutions for clients and trustees on all aspect of superannuation including:

  • Establishment of SMSFs
  • Compliance services
  • Property acquisitions
  • Pension structuring
  • SMSF ATO administration and dispute services

Christine’s qualifications include:

  • Bachelor of Commerce (Accounting)
  • Member of the Institute of Chartered Accountants
  • Master of Commerce (Finance)
Michelle Jolliffe

Michelle Jolliffe

Associate - Business Services B Com (Accounting) CA

About Michelle

Michelle has been with the firm in excess of 13 years and is an Associate in our Business Services Division.

Michelle and her team provide taxation and business advice to a wide variety of clients. Technically strong Michelle can assist with all matters in relation to taxation covering Income and Capital Gains Tax; Land Tax; GST; Payroll Tax and FBT.

Michelle is an innovative thinker and problem solver and always brings an in-depth and informed view to the discussion when advising clients.

Michelle has considerable experience with business acquisitions and sales as well as business restructuring.

Michelle’s qualifications include:

  • Bachelor of Commerce (Accounting)
  • Member of the Institute of Chartered Accountants
Joanne Douglas

Joanne Douglas

Certified Financial Planner and Representative CFP SSA Dip FP

About Joanne

Joanne commenced with Level One in 2004 and has developed into one of our Senior Financial Advisers.

With over 20 years of experience, Joanne and her team provide advice across a wide variety of areas including: Superannuation; Retirement Planning; Centrelink; Aged Care; Portfolio Management and Estate Planning.

A real people person Joanne builds strong long term relationships with her clients by gaining an in-depth knowledge of their personal goals and aspirations while providing tailored financial solutions to meet those needs.

Joanne’s qualifications include:

  • Certified Financial Planner (CFP)
  • Self Managed Superannuation Firm Specialist Adviser
  • Diploma of Financial Planning

Disclaimer & Privacy Policy

Disclaimer

The information contained on this web site is general information only. You agree that your access to, and use of, this site is subject to these terms and all applicable laws, and is at your own risk. This site and its contents are provided to you on “as is” basis, the site may contain errors, faults and inaccuracies and may not be complete and current.

It does not constitute personal financial or taxation advice. When making an investment decision you need to consider whether this information is appropriate to your financial situation, objectives and needs.

Level One makes no representations or warranties of any kind, expressed or implied, as to the operation of this site or the information, content, materials or products included on this site, except as otherwise provided under applicable laws. Whilst all care has been taken in the preparation of information contained in this web site, no person, including Level One Taxation & Business Advisors Pty Limited, accepts responsibility for any loss suffered by any person arising from reliance on the information provided.

Privacy

Level One highly values the strong relationships we have with our clients. The collection of data at Level One is being handled with full and proper respect for the privacy of our clients. The data we collect is handled sensitively, securely and with proper regard to privacy laws. Level One does not disclose, distribute or sell the data we collect from our clients to third parties.