LevelOne Logo
Header Background

Article Archive

Quarterly Review January 2017

Share Market Update

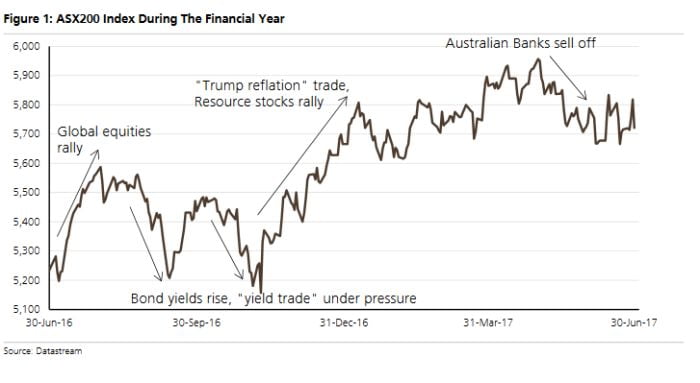
After a volatile start to the December quarter the ASX200 performed strongly to close the 2016 year at 5,665.80, up 229.9 points on the 30 September 2016 close of 5,435.90. This represents a gain of 4.23% for the December quarter.

Overall the 2016 calendar year was positive with the market increasing from 5,295.90 at 31st December 2015 to 5,665.80 on 30th December 2016 – a gain of 369.90 points or 6.98% for the twelve month period.

The overall positive performance of Australian and international equity markets this year belies high levels of volatility including the aftermath of the US presidential election and Brexit.

Brexit was the first major market mover in 2016. With financial markets pricing in a “remain” vote, the outcome of the British poll led to a violent sell-off in global equities. Similarly, with markets as well as bookies and pollsters anticipating Hillary Clinton would be the next US president, Donald Trump’s surprise win caught investors off guard and equity markets again plummeted.

Despite the markets’ initially negative response to these events, sustained and dramatic declines did not transpire as expected. Instead, equity markets went on to stage strong recoveries. Notably, in the US the “Trump bump” propelled the market to hit record highs.

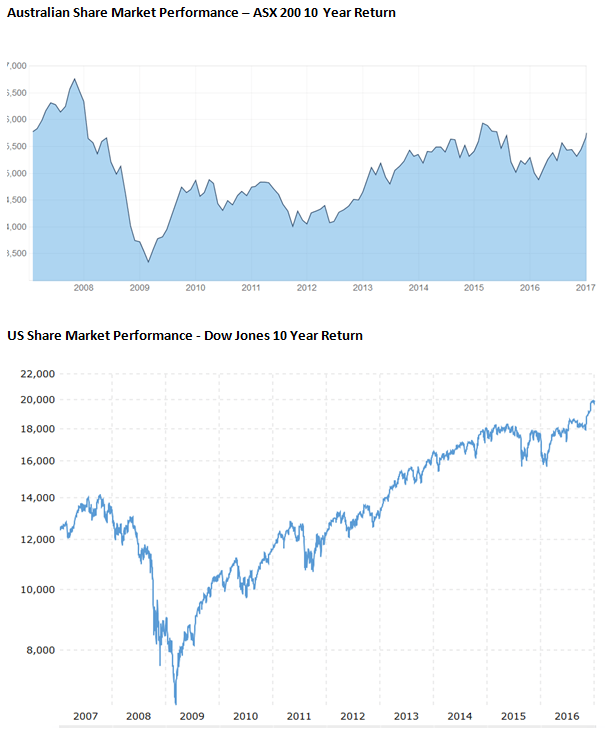
The US share market has run very strongly over the past 9 years. On 9th October 2007 before the Global Financial Crisis (GFC) the Dow Jones Index was 14,164.53 points. The market returned to this level again in March 2013. The Dow Jones hit a record high 19,974.62 on 20th December 2016 which is 41% above its pre-GFC high.

In comparison our market is currently still 21.31% below the market high when the ASX200 Index hit a record high of 6,873.20 on 1st November 2007, which is now over nine years ago. Refer to the ASX200 & Dow Jones 10 year performance graphs below.

Looking to the year ahead, we expect the Australian economy will continue to show signs of growth, albeit modest. We anticipate the Australian share market will be heavily influenced by global events including how and when the UK exits the European Union and how uncertainty surrounding the implementation of President-elect Trump’s election policies will playout.

Economic Update

Happy new (calendar) year! We hope that you had a great Christmas season and are ready to jump into 2017. Well, 2016 was interesting: Brexit, Trump and the biggest shake up in superannuation legislation we have seen since the 1990’s.

Over the course of 2016, the Australian economy continued to expand at a moderate pace, as transition drivers, particularly strong growth in dwelling investment, helped offset declines in mining investment.

While none of the growth factors, individually or concurrently, suggests that we are on the cusp of a return to the type of growth rates seen before 2008, they do suggest that the economy continues to rebalance from the downswing in the commodities boom. In particular, it is estimated that mining investment is approximately half way down from its peak of 8% of GDP and should reach pre-boom levels of 1.5% of GDP by late 2018. Consistently, while mining investment is still expected to subtract from growth over the near term, it is estimated that the trajectory after 2017 should be no steeper than what we have been accustomed to in recent years. Against this backdrop, the Australian economy is expected to centre on its current long-term potential growth of 2.7% in 2017.

In the labour market, the unemployment rate has declined a little further over recent months. While this suggests that labour market conditions have continued to improve, broader measures of labour market utilisation have indicated otherwise. In particular, following strong growth in late 2015, employment growth has slowed to a more modest pace and the increase in employment since then has been heavily skewed towards part-time jobs, reflecting the rebalancing of activity towards the services sector. Approximately 45% of employment in household services is part-time while the share for business services is 25%. This compares with a share of just 3% in the mining sector.

Consequently, the weakness in wage growth could imply that underlying inflation will remain below target for some time.

In the housing market, dwelling investment, particularly the construction of higher-density dwellings (apartments), continues to grow at an above-average rate. While the pipeline of residential work is expected to support a high level of dwelling investment for some time, the rate of growth in dwelling investment is expected to moderate over the next two years.

From a monetary policy perspective, the Reserve Bank of Australia (RBA) is expected to remain data dependent as they gauge the impact of the two rate cuts delivered in 2016.

Although the heat in the housing market has largely been confined to Sydney and Melbourne, the record high household gearing levels still counts strongly against the RBA providing further cuts until they feel more confident in their judgments around the housing and labour market. The RBA kept rates on hold throughout the last quarter of 2016 and won’t meet again until February 2017. Governor Philip Lowe echoed his predecessor and remained consistent in the watch and wait strategy adopted throughout much of 2015 and 2016.

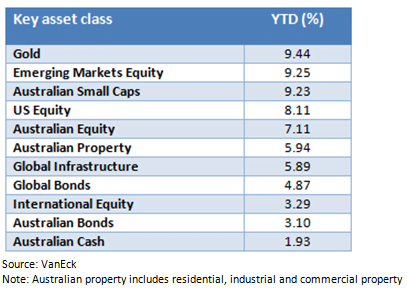
Despite the political complexities globally, 2016 was largely a positive year for markets with key asset classes experiencing positive returns (see below). Although we expect the volatility in markets to continue we believe this presents some good buying opportunities for long term investors.

Property Market Update

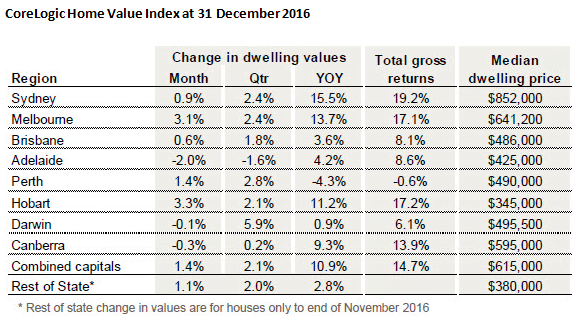
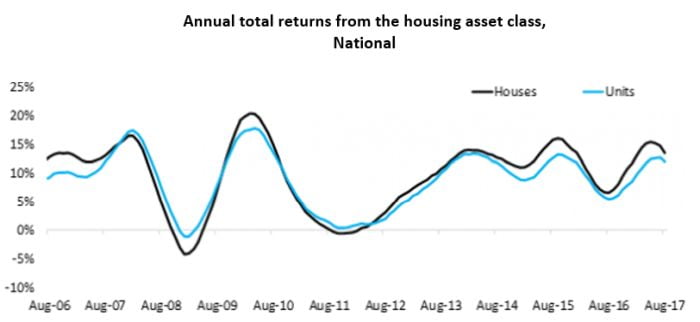
Capital gains accelerated over the past year, taking the calendar year growth rate to the fastest pace since 2009. December 2016 saw capital city dwelling values rise by 1.4%, taking the annual capital gain for 2016 to 10.9%; the highest growth rate for a calendar year since 2009. Factoring in gross rental yields and capital gains, housing as an asset class, earned a total annual return of 14.7% based on the combined capital cities index results.

Across Australia’s capital cities, the annual change in dwelling values for 2016 ranged from -4.3% in Perth to 15.5% in Sydney, with Melbourne and Hobart also showing annual capital gains higher than 10%.

Capital city growth rates have also shown a growing divergence between the broad housing product types. Over the past twelve months capital city house values have risen by 11.6%, while unit values have increased by roughly half the pace at 5.9%.

The divergence in growth rates is the most distinct in Melbourne and Brisbane, where concerns around unit oversupply have eroded buyer confidence. Melbourne house values are up 15.1% over the year compared with a 1.7% rise in unit values, while Brisbane house values are 4.0% higher over the year, with unit values falling by -0.2%.

Australia’s regional housing markets generally did not experience the same growth conditions as the capital cities, with annual growth to November recorded at 2.8% across the combined regional markets. Regional New South Wales showed the strongest growth conditions, with non-capital city house values rising 7.3% over the 12 month period to November 2016. The remaining rest-of-state regions showed relatively sedate conditions, with values rising by half a per cent across regional Victoria, 1% across regional Queensland and 1.1% across regional South Australia. Regional Western Australia recorded a 7% fall in house values over the year.

Regional areas with intrinsic ties to the mining and resources sector have continued to record weaker housing market conditions since the end of the mining infrastructure boom, with Perth and Darwin recording the weakest housing market conditions across the capital cities.

Since values peaked in these markets during 2014, values have fallen by a cumulative 7.9% in Perth and 5.9% in Darwin. More recently both these markets have shown signs of moving through the low point of their respective downturns, with values rising by 2.8% and 5.9% respectively over the final quarter of 2016.

Based on the annual housing market results, it is clear that housing markets across Australia have responded to regional differences in economic and demographic trends; strong population growth and economic activity have driven value growth in Sydney and Melbourne, however, more recently strong growth trends have spread to Hobart and Canberra, as well as many of the coastal and lifestyle markets where values are now also rising swiftly.

Post Global Financial Crisis, the CoreLogic index results show that Sydney’s dwelling values have almost doubled, rising by 97.5% since January 2009, whilst Melbourne dwelling values have increased by 83.5% over the same time frame. Every other capital city has seen dwelling values rise at substantially lower rates over this period, highlighting just how strong the Sydney and Melbourne housing market conditions have been over the past 8 years.

Sydney-siders saw dwelling values increase by approximately $10,000 per month over the past year, creating a significant boost in wealth for home owners; at the same time we’ve seen mounting affordability challenges for aspiring home owners.

The recent CoreLogic Housing Affordability Report shows Sydney dwelling prices were 8.3 times higher than annual household incomes and households were dedicating an average of 44.5% of their income to service a mortgage (based on an 80% loan to valuation ratio and the average discounted variable mortgage rate).

Quarterly Review April 2017

Share Market Review

The ASX200 posted a positive return for the first quarter of 2017, closing at 5,864.90 – up 199.10 points or 3.51% for the three month period 1 January 2017 to 31 March 2017.

The ASX200 has now moved up 641.5 points or 12.28% for the 2016/2017 financial year with a quarter still to go.

The end of the quarter also saw the ASX200 push through the 5,900 barrier to reach a high of 5,901.50, its highest since late April 2015.

The quarter was dominated by company reporting season, which overall was very solid. Areas that were expected to deliver strong results such as housing related exposures and resources, did deliver on those expectations. The Banking and Insurance sectors delivered better growth than the previous period.

Weaker sectors included telecommunications, gaming and traditional media companies.

Dividends were strong across the board with payout ratios increasing across the market.

Whilst the overall message from the reporting period was strong, this hasn’t led to upgrades on forecasts for the full financial year.

In the US, the first quarter earnings season gets underway in the coming week and this will be an important test for the stock market rally. If US companies deliver or under-deliver, Wall Street will react and our market will likely follow.

It is looking more likely that the ASX200 will get through the 6,000 point barrier – a place it hasn’t been since January 2008.

For the market to continue rising for the remainder of 2017 we will require the following:

  • Strong US earnings.
  • That the US Fed doesn’t raise interest rates too fast.
  • US economic data remains strong.
  • China’s economy to remain positive.
  • The French election doesn’t have a bad result and raise question marks over the longevity of the EU.
  • Syria doesn’t get out of hand.
  • Donald Trump’s ability to deliver on promises in particular the tax reform package.

As we saw in 2016 with Brexit and the US election, uncertainty can cause a big ripple in markets and volatility is expected to continue. Any of the above factors could cause a dip in the market which could very well present a buying opportunity for long term investors.

Economic Update

GDP grew by 1.1% to be 2.4% higher through-the-year (December 2016 quarter over December 2015 quarter). This is a welcome outcome but we should not get too carried away. The non-mining economy continues to suffer from weak growth in demand, which continues to see weakness in employment. On a positive note, private consumption expenditure grew by 0.9% in December (adding 0.5% to GDP) and is forecast to return to more sustainable growth rates between 0.5% to 0.7% per quarter over the next two years. This will moderate quarterly GDP growth.

The Reserve Bank of Australia held the cash rate steady at 1.50% throughout the first quarter of 2017, continuing to defend their stance on monetary policy. In his speech on 7 March 2017, Governor Phillip Lowe confirmed that business and consumer confidence was improving although there were still concerns around China’s consumption of our commodities going forward. Governor Lowe also advised that exports have risen strongly and non-mining business has also increased over the past year. All-in-all Australia’s economy is growing and is being supported by the low interest rate environment.

Retail sales fell 0.1% in February, much weaker than consensus, stifling expectations that last month’s solid 0.4% was the start of a better trend. The year on year eased to just 2.7%, from 3.1%, its slowest in 3½ years. Sales at larger retailers were also soft, flat after 0.8%. Weakness was broad-based, with declines in clothing and household goods, while ‘eating out’ was flat, with food up modestly.

Residential building approvals beat expectations again, jumping 8.3% in February. With January revised up from 1.5% to 2.2%, this is broadly consistent with expectations for a correction, but not a collapse. The value of renovations (i.e. alterations and additions) jumped 14%, after last month’s 19% fall, but remain on a relatively flat trend.

The Australian Prudential Regulatory Authority (APRA) announced additional macroprudential policy tightening for housing in March. The most binding constraint was a new cap on the flow of interest-only home loans to only a 30% share, which is well below the decade average share of ~40%. This is likely to be partly indirectly aimed at investors where interest only has been a very high ~60%+ share for many years; albeit owner-occupiers have also lifted to a significant ~23% share.

APRA also told financial institutions to “place strict internal limits” on interest only loans with a loan to value ratio (LVR) greater than 80%, and ensure strong justification for loans greater than 90% LVR.

We believe that the actions taken by APRA will keep the RBA from hiking interest rates prematurely. Nevertheless, the rate of household debt growth is concerning and will continue to be the focus of the regulators.

Treasurer Morrison brings down the 2017/2018 Commonwealth Budget on 9 May. The combination of a stronger underlying economy, higher received corporate taxes, higher than expected commodity prices, which conservatively must boost figuring for the next year or so, and a current year budget tracking better than forecast suggest this should be the first budget in a number of years showing modest improvement from the mid-year economic and fiscal outlook (MYEFO).

While election timing argues against overly optimistic budget projections, we believe any underlying improvement in the budget will be used to fund 1) a moderately higher 2020/2021 surplus that makes it less ‘wafer thin’, 2) paying away long-standing ‘unpassed’ saving measures that have attracted criticism and 3) a higher contingency reserve (‘rainyday saving’) for future policy. In contrast to prior years, this should all be within the context of a slightly faster reduction in the budget deficit to a 2020/2021 surplus.

The budget will focus on recent flagship policies of lower company tax rates and higher childcare rebates. New policy likely targets infrastructure and revenue protection (from the cash economy, to welfare and multinationals). There is some potential for measures aiding housing affordability (reduced tax benefits), and some risk of new resource taxes.

Property Update

The Illawarra region has delivered the highest value growth for property owners according to the latest CoreLogic Regional Report released for the December quarter.

The Illawarra region recorded the largest annual increase in values for both houses at 15.2%, and units at 14.8%.

Growth was more moderate across the Richmond-Tweed and Newcastle & Lake Macquarie regions, with home values rising by less than 10%.

Sales volumes data shows that the Richmond-Tweed region saw an increase in transaction activity, up 5.3% over the year to November, while Illawarra and Newcastle & Lake Macquarie both saw a decrease in sales volumes.

Across Queensland, Townsville recorded the largest decrease in dwelling sales over the year to November 2016, down -14.4% to 3,119 sales, followed by the Gold Coast, which saw dwelling sales fall -9.5% to 19,046 sales.

Looking at home values in regional Queensland, the Gold Coast saw the biggest increase over the year to December, up 6.9% for houses and 5.5% for units, followed by the Sunshine Coast, up 4.5% for houses and 3%. House and unit values across Townsville fell -3.2% and -3.8% respectively, while values across Cairns rose moderately for houses (up 0.9%) and were unchanged for units. The Wide Bay region saw house values increase slightly (0.6%) while unit values fell -2.0% over the same period.

Moving to regional Victoria, across Geelong and Latrobe–Gippsland, sales activity was down 2% over the year; however median values rose over the year to December. Geelong recorded the strongest performance in regional Victoria, with house values rising by 5% and unit values up 3.1%, while Latrobe-Gippsland house and unit values increased by 2.1% and 2% respectively.

In Western Australia’s Bunbury region, house values increased by 5.7% over the 12 months to December 2016, while unit values fell -3.5%. Sales volumes across Bunbury over the year to November were -7.9% lower than they were in November 2015.

In capital cities Sydney experienced the greatest increase jumping 15.5% and Melbourne was not far behind increasing 13.7% over 2016.

Source: RP Data

Superannuation Update June 2017

Overview

The end of financial year is fast approaching and with that brings new Superannuation legislation that comes into effect 1 July 2017 – the biggest changes to superannuation in nearly a decade!

We’ve summarised below some last minute planning opportunities and also issues that you may need to consider.

If you think you may be affected by any of the below issues or would just like to review your superannuation and retirement planning position please do not hesitate to contact our office.

Concessional Cap

Concessional Contribution Cap will decrease to $25,000 for everyone.

The concessional contribution cap will be reduced from $30,000 to $25,000, or for those who were 49 or older on 1 July 2016, from $35,000 to $25,000.

Concessional contributions include your employer’s contribution (the compulsory 9.5%), plus any amount you salary sacrifice, or if self-employed, any amount you claim a tax deduction for.

Action Required: If you are making salary sacrifice contributions, you will need to review these from 1 July to make sure that you are under the new cap of $25,000.

Planning Opportunity: As this is the last year of the higher cap, the obvious strategy is to assess whether you can utilise the full cap in 2016/17. If cashflow permits, accelerate salary sacrifice amounts this year, or if self-employed, make the full contribution prior to 30 June 2017.

Non-Concessional Cap

Non-Concessional Contribution Cap will drop to $100,000.

The non-concessional cap reduces from $180,000 to $100,000. Non-concessional contributions are your own personal contributions for which you can’t claim a tax deduction.

Planning Opportunity: Do you have cash or assets that you could or were planning on moving into superannuation? Can you make the contribution before 30 June 2017?

Bring-Forward Rule

Accessing the Bring-Forward Rule (Applies to Non-Concessional Contributions).

With the decrease in the non-concessional cap to $100,000, the limit under the “bring forward” provisions, which allows people who are under 65 to make up to three years of non-concessional contributions in a single financial year, will fall from $540,000 to $300,000.

Planning Opportunity: If you want to get a large amount into super, do it before 30 June 2017. And as the limit applies per person, if you have a partner, then you can effectively get up to $1,080,000 in super now. From 1 July 2017, this will only be $600,000 combined.

Balances Above $1.6 Million

If your total superannuation balance exceeds $1,600,000, you won’t be able to make any non-concessional contributions at all.

This is a new constraint to apply from 1 July 2017. Super balances will be measured each June 30 (i.e. your balance at 30 June 2017 will determine whether you can make a non-concessional contribution in the 2017/18 financial year).

Planning Opportunity: If your superannuation balance is greater than $1.6 million you will need to make a contribution before 30 June 2017 as, after this time you will no longer be able to contribute into superannuation personally.

Pension in Excess of $1.6 Million

Anyone who has more than $1.6 million in pension phase will need to remove the excess, either by a lump sum withdrawal from super, or by rolling it back into the accumulation phase within your super fund.

The measurement date is 30 June 2017.

Transitional relief is available if your balance is between $1.6 million and $1.7 million – you will have until 31 December 2017 to comply. If you have more than $1.7 million however, you are required to comply by 1 July 2017.

From a tax point of view, it will usually make sense to roll the money back into the accumulation phase as the 15% tax rate is still concessional. However, if you are not utilising your personal tax free threshold of $18,200 then, from a tax point of view, withdrawing some or all of the excess as a lump sum and investing it in your own name may deliver a better outcome.

Transition to Retirement Pensions

The investment earnings of assets supporting a TRIS will be taxed at 15% from 1 July 2017, rather than the current 0%.

As this removes the key financial incentive to have a TRIS, you will need to consider if this is still a viable option for you or if you should cease your TRIS.

Government Co-Contribution

Government Co-Contribution – Money for nothing!

If you meet the following criteria:

  • Your total income is equal to or less than the lower threshold ($36,021 for the 2016/2017 financial year);
  • 10% of your eligible income must come from employment-related activities, carrying on a business, or a combination of both;
  • You were less than 71 years old at the end of the financial year;
  • You lodge a tax return;
  • You make personal contributions of $1,000 to your super account.

Then you will receive the maximum co-contribution of $500.

If your eligible income is above the lower threshold of $36,021 but below the upper threshold of $51,021 for the 2016/2017 financial year, and you satisfy the above criteria, you will be eligible to a reduced Government Co-Contribution.

SMSF Trust Deed Update

Review your SMSF Trust Deed – An update may be required.

Does your Trust Deed allow the ability to specifically nominate or remove reversionary beneficiaries during the lifetime of the superannuation pension without ceasing the pension? If not, you need to consider updating your trust deed.

Having this flexibility is beneficial for the following reasons:

  • Maintaining Centrelink grandfathering provisions for pre-January 2015 super pensions in relation to the Commonwealth Seniors Health Card (CSHC) and Age Pension income test;
  • Maximising the amount of money you can retain in pension phase if you are the recipient of a death benefit pension in the future;
  • Allowing a 12-month period to correct a breach of the $1.6 million pension cap when a superannuation member receives a death benefit pension from a deceased member. For example, if each member had a pension balance of $900,000 and one member dies, leaving the super pension to the surviving member, the surviving member will now have $1.8 million invested in pension phase – $200,000 over the $1.6 million cap. Where a reversionary pension nomination is in place, the surviving member will have 12 months to correct this excess. This extra time to make corrections is valuable at what is an already stressful and emotional time.

Federal Budget 2017 – Tax and Spend

Overview

The key messages out of the 2017 – 2018 Federal Budget were “making the right choices to secure the better days ahead” through a “fair and responsible path back to a balanced budget” based on “the principles of fairness, security and opportunity”. As was the underlying sentiment of the previous year’s Budget, the choice is to “ensure the Government lives within its means” while still having a plan to:

  • grow the economy to create more and better paid jobs;
  • guarantee the essentials that Australians rely on; and
  • reduce cost of living pressures.

A key summary of the 2017 -2018 Federal Budget announcements are summarised below. We note that these measures as announced still need to pass through the senate to become law.

Personal Income Tax

0.5% Increase in Medicare Levy – From 1 July 2019, the Medicare levy will increase by 0.5% to 2.5% of taxable income. This increase ensures that the National Disability Insurance Scheme (NDIS) is fully funded.

Increase to Medicare levy low income thresholds – The Medicare levy low-income threshold will be indexed for individuals and families. The threshold for singles will increase to $21,655 per annum (up from $21,335) and for couples with no children, increase to $36,541 per annum (up from $36,001).

Small Business

Extension of $20,000 immediate asset write-off – The $20,000 instant asset write-off for businesses with an aggregated annual turnover of less than $10m will be extended by 12 months to 30 June 2018. Software will continue to be excluded from these measures.

Restriction on accessing Small Business CGT Concessions – From 1 July 2017, access to the Small Business CGT Concessions will be tightened to deny eligibility for assets which are unrelated to a small business.

Superannuation

Access to superannuation for first home deposit – From 1 July 2017, individuals will be able save for their first home deposit by making voluntary contributions into their superannuation of up to $15,000 per year (to a maximum of $30,000 in total). The contributions and deemed earnings can then be withdrawn subsequently (from 1 July 2018) for a first home deposit.

The contributions can be made to an existing superannuation account and must be within an individual’s existing contribution cap. The contributions can be “salary sacrifice” contributions, or non-concessional contributions from after tax funds.

The scheme is intended to provide an incentive to enable first home buyers to build savings faster for a home deposit, by accessing the tax advantages of superannuation. Salary sacrifice contributions will be taxed at 15%, as will the earnings by the fund. Withdrawals will be taxed at an individual’s marginal tax rate, less a 30% tax offset.

This scheme does not replace the Super Guarantee Contributions (9.5%).

Super contributions from downsizing – From 1 July 2018, a person aged 65 or over can make a non-concessional contribution into superannuation of up to $300,000 from the proceeds of selling their principal residence where the property has been owned for more than 10 years. Accordingly, a couple that jointly owns their home can collectively contribute $600,000 to superannuation.

These contributions can be made in addition to the existing rules and caps and are not subject to the age or work test or the $1.6m limit applicable to other non-concessional contributions.

Limited Recourse Borrowing Arrangements (LRBA) included in super balance and transfer balance cap – The ability to use Limited Recourse Borrowing Arrangements (LRBA) will be restricted. For the purposes of the $1.6m superannuation limit, from 1 July 2017 the outstanding balance of a LRBA will be included in a member’s annual total superannuation balance and the repayment of the principal and interest of an LRBA from a member’s accumulation account will be a credit in the member’s transfer balance account.

Social Security

Reinstatement of Pension Concession Card Entitlements – Pensioners who lost their Pensioner Concession Card entitlement due to the asset test changes on 1 January 2017 will have their card reinstated.

Those affected will receive the Pensioner Concessioner Card from 9 October 2017.

Energy Assistance Payment – The Government will make a one-off Energy Assistance payment of $75 for single recipients and $125 per couple for those eligible for qualifying payments on 20 June 2017 and who reside in Australia. The payment will automatically be paid in the week commencing 26 June 2017 and is non-taxable and will not be counted as income.

Qualifying payments include Age pension, disability support pension, parenting payment single, Veterans Service Pension and War Widow Pension.

Property

Travel expenses related to residential rental properties disallowed – From 1 July 2017 deductions for travel expenses related to inspecting, maintaining or collecting rent for a residential rental property will be disallowed.

Depreciation deductions limited for residential rental properties – From 1 July 2017 plant and equipment depreciation deductions will be limited to outlays actually incurred by investors in residential rental properties. Plant and equipment items are usually things which can be “easily” removed from the property such as dishwashers and ceiling fans. There will be no deduction for acquisitions of existing plant and equipment items by subsequent purchasers of the property.

Bank Levy

Major bank levy to be introduced – From 1 July 2017 a major bank levy will be introduced for authorised deposit taking institutions (ADIs) with licensed liabilities of at least $100b. This levy will be calculated quarterly as 0.015% of an ADI’s licensed entity liabilities equating to 0.06% annually. Liabilities subject to the levy include corporate bonds, commercial paper, certificates of deposit and Tier 2 capital instruments. The levy will not apply to the deposits of individuals and mortgages.

The levy is budgeted to collect $6.2b over the forward estimates.

International Tax Measures

Capital Gains Tax changes for foreign investors – Foreign and temporary tax residents will no longer be eligible for the capital gains tax (CGT) main residence exemption from 7:30PM on 9 May 2017. However, existing properties held prior to this date will be grandfathered until 30 June 2019. Sales after this date will not be eligible for the main residence exemption.

Changes to withholding obligations for foreign tax residents – Currently, the foreign resident CGT withholding obligation applies to foreign tax residents disposing of Australian real property and related interests valued at $2m or more. This threshold will be reduced to $750,000 from 1 July 2017, therefore increasing the number of properties and interests subject to this withholding obligation. The CGT withholding rate will also be increased from 10% to 12.5% from 1 July 2017.

Annual charge on foreign owners of underutilised residential property – The Government will introduce an annual ‘levy’ on foreign owners of residential property where the property is not occupied or genuinely available on the rental market for at least six months per year. The annual levy will be equivalent to the relevant foreign investment application fee (minimum fee is $5,000) imposed on the property when it was acquired.

Restrict foreign ownership in new developments to no more than 50% – The Government will impose a 50% cap on foreign ownership in new developments through a condition on new dwelling exemption certificates.

Year End Tax Planning 2017

With only 2 weeks to go until June 30th we outline below some last-minute tax planning opportunities.

If you would like to discuss any of the following in relation to your business please do not hesitate to contact our office on 02 4227 6744.

Tax Deductions

Capital Expenditure up to $20,000

For expenditure on capital items that cost less than $20,000 there is an immediate write-off for businesses with turnover less than $10 million.

Bad Debt Deductions

A taxpayer can only claim a bad debt if the debt:

a) Is written off before year end; and
b) Has previously been included in the taxpayer’s assessable income.

Trading Stock

Trading stock can be valued at year end using one of the following methods:

1) Cost price; or
2) Market selling value; or
3) Replacement value.

The provisions allow a choice of method for each individual item.

Obsolete stock can also be effectively written off giving rise to a tax deduction.

Prepayments

Individuals and businesses with an annual turnover of less than $10 million may be eligible for an upfront deduction where the service period is less than 12 months.

Employee Bonuses

Bonuses paid prior to 30 June are tax deductible this year.

Superannuation Considerations

Superannuation Guaranteed Contributions (Employee Super)

Employee superannuation contributions are legally payable by the 28th day after the end of each quarter.

From a taxation perspective, you only get a tax deduction in the year that contributions are actually paid.

Therefore, you could pay the June quarter SGC prior to 30 June 2017 and claim a tax deduction this financial year rather than next year.

Maximum Deductible (Concessional) Contributions Cap will decrease to $25,000 for everyone

From 1 July 2017, the concessional contribution cap will be reduced from $30,000 to $25,000, or for those who were 49 or older on 1 July 2016, from $35,000 to $25,000.

Concessional contributions include your employer’s contribution (the compulsory 9.5%), plus any amount you salary sacrifice, or if self-employed, any amount you claim a tax deduction for.

Non-Concessional Contributions Cap will drop to $100,000

From 1 July 2017, the non-concessional cap reduces from $180,000 to $100,000. Non-concessional contributions are your own personal contributions for which you can’t claim a tax deduction.

Income and Expenditure

Bring-Forward Expenditure

Often costs that will arise in July or August can be brought forward into the current year and claimed this financial year.

Defer Income

While consideration needs to be given to a business’ cash flows, sometimes income or invoicing clients can be postponed until July or later in the year and hence reduce taxable income now.

Super Guarantee: What Happens When You Get It Wrong?

The ATO receives around 20,000 reports each year from people who believe their employer has either not paid or underpaid compulsory superannuation guarantee (SG). In 2015-16 the ATO investigated 21,000 cases raising $670 million in SG and penalties.

The ATO’s own risk assessments suggest that between 11% and 20% of employers could be non-compliant with their SG obligations and that non-compliance is “endemic, especially in small businesses and industries where a large number of cash transactions and contracting arrangements occur.”

So what happens if your business gets SG compliance wrong?

Under the superannuation guarantee legislation, every Australian employer has an obligation to pay 9.5% Superannuation Guarantee Levy for their employees unless the employee falls within a specific exemption. Super guarantee payments are calculated on Ordinary Times Earnings – which is salary and wages including things like commissions, shift loadings and allowances, but not overtime payments.

Employers that fail to make their superannuation guarantee payments on time need to pay the SG charge and lodge a Superannuation Guarantee Statement. The SG charge applies even if you pay the outstanding super soon after the deadline.

The SG charge is particularly painful for employers because it is comprised of:

  • The employee’s superannuation guarantee shortfall amount – so, all of the superannuation guarantee owing;
  • Interest of 10% per annum; and
  • An administration fee of $20 for each employee with a shortfall per quarter.

Unlike normal superannuation guarantee contributions, SG charge amounts are not deductible, even if you pay the outstanding amount. That is, if you pay SG late, you can no longer deduct the SG amount even if you bring the payment up to date.

The penalties imposed on the employer for failing to meet SG obligations on time might seem harsh, but they have been designed that way on purpose. This is really money that belongs to the employee and should be sitting in their superannuation fund earning further income to support the employee in their retirement. The best way to avoid penalties is to make your super payments on time, every time.

Directors are personally liable for unpaid SG

Where attempts have failed to recover superannuation guarantee from the employer, the directors of a company automatically become personally liable for a penalty equal to the unpaid amount.

Directors who receive penalty notices need to take action to deal with this – speaking with a legal adviser or accountant is a good starting point.

If you are uncertain about your SG obligations or would like a compliance audit of this and other key risk areas of your business, contact us today.

Quarterly Review July 2017

Share Market Update

The ASX200 index posted a strong return of 9.3% for the twelve month period 1 July 2016 to 30 June 2017. The total return including dividends was 14.1% for the twelve month period.

The return was driven by increases in earnings during the period which is a very positive sign. This is the strongest contribution of earnings since the 2009 / 2010 financial year.

The Mining & Metals sector performed best over the 2016/2017 financial year (+27.60%), though it was a “tale of two halves” for the sector, with its performance heavily loaded into the first 6 months.

Other Financials (+26.8%), Insurance (+22%) and Materials ex Mining (+17.6%) also performed well throughout the financial year, while Telcos (-21.7%) and REITs (-6.3%) underperformed.

In stark contrast to the 2015/2016 financial year, small caps underperformed during the 2016/2017 financial year. However, in a repetition of 2015/2016 financial year, mid -caps outperformed.

Another notable difference to the 2015/2016 financial year was that “Yield” sectors underperformed during the 2016/2017 financial year. The 2016/2017 financial year was the year in which the “Growth” trade came unstuck and “Value” finally had its day in the sun.

While we don’t expect a repeat of last financial year’s return for the ASX200 we are positive on the sector. With a circa 5% dividend yield and term deposit, cash rates and bond yields still looking unattractive, equities still look like a superior relative option in our view.

Economic Update

Happy New Financial Year!!

The 2016/2017 financial year began ablaze with volatility, uncertainty and confusion (Brexit being a significant contributor), with the effects of these elements continuing throughout the year.

2017/2018 was born during slightly calmer times, albeit with similar conditions we saw last year – central banks slow and reluctant to tighten monetary policy, market volatility present but somewhat subdued compared to 12 months ago, and global political uncertainties keeping journalists in employment.

The Reserve Bank of Australia (RBA) only reduced the cash rate once in the last financial year by 25 basis points to 1.50%. We remain on hold here again this month, 11 months and counting. The minutes from the recent RBA meeting read very much the same as the preceding months – economic growth slow but continuing, still keeping a close watch on China, the housing boom has helped ease the decline in mining investment income and that the increase in commodity prices have boosted our national income.

Governor Philip Lowe commented that household debt has outpaced household incomes and indicated that their stance on keeping the cash rate on hold again was largely centred around this factor. The continued and rapid increase in household debt, irrespective of the strong growth in property prices, bears a huge amount of risk when wage growth continues to be sluggish and real estate prices in some areas of the country have started to decline.

The US Fed began increasing interest rates late last year and June saw the third increase in six months. The US funds rate now sits at a modest 1.25%, though further rate increases are to be expected over the next 12 months.

There have been some signs that other central banks may move to increase their rates as well. The UK and Canadian central banks have been talking about a rate rise and the European Central Bank (ECB) has also spoken of possibly reducing its quantitative easing program. The common theme of these nations, as well as ours, over the past 12 months has been to wait and watch but, the times are a changin’…

Australian GDP rose 0.3% in the March 2017 quarter – 0.8% lower than the previous quarter but positive nonetheless. Consumer confidence has been the primary drag on economic growth, with consumers weighed down by job concerns, rising debt levels and low wage growth. Strong business confidence of late is leading to better jobs growth, which should help tip the scales in the right direction.

The unemployment rate declined to 5.5% in June 2017 – the lowest since mid-2014. This is another important indicator for the RBA when deciding when it is the right time to raise our cash rate, however we expect the RBA would like to see this decline further before taking action.

As with all new beginnings, opportunities can be found for those who seek them, and we believe the 2017/2018 financial year will not disappoint. We do remind investors to be patient however and not make knee-jerk decisions.

Property Market Update

Latest quarterly statistics from RP Data CoreLogic indicate that Sydney and Melbourne might be slowing down. Recent auction clearance rates have also softened, so when you put these two indicators together, we either have a seasonal glitch or perhaps the first sign that the boom is over in these two cities.

Price growth continued in Sydney for the 2016/17 financial year at a rate of 13% for houses and 8.6% for apartments. Melbourne price growth was 15% for houses and 1.5% for apartments.

What is more notable though is the change between the March and June quarter results for both cities. Overall dwelling values in Sydney went from 5% growth in March to 0.8% growth in June. Melbourne dwelling values went from 4.2% in March to 1.5% in June.

The biggest elements that will end the boom is affordability and lending restrictions to investors.

Affordability is always a factor at the end of booms – prices get too high and people exit the market, with many giving up and deciding to stay put and renovate instead of trading up.

The other big influence is investor activity. Investors tend to start and end booms. They get in when they see opportunity and they get out when that opportunity has eroded.

Investors are after two things – capital gains and rental yields. Both Sydney and Melbourne are likely to have several years ahead with far more moderate gains. Yields are also low, which makes it harder for investors to cover their mortgage. Average yields for Sydney houses are 2.8% and apartments 3.7%. In Melbourne, it’s 2.6% and 4.2% respectively.

On top of this, lenders are making it harder to borrow money. So even if there were still many investors out there keen to buy, a significant proportion will find it too difficult due to stricter serviceability, a crackdown on interest-only lending and higher mortgage rates on investment loans.

Looking at the national picture, here’s what happened across the capital cities in the 2016 /2017 financial year.

House prices

  • Sydney – house prices up 13% to a median $1.050 million
  • Melbourne – house prices up 15% to a median $755,000
  • Brisbane/Gold Coast – house prices up 3.3% to a median $555,000
  • Canberra – house prices up 9.7% to a median $693,000
  • Adelaide – house prices up 2.7% to a median $465,000
  • Perth – house prices down -1.9% to a median $500,000
  • Hobart – house prices up 7.4% to a median $375,000
  • Darwin – house prices down -6.2% to a median $500,000

Apartment prices

  • Sydney – apartment prices up 8.6% to a median $750,000
  • Melbourne – apartment prices up 1.5% to a median $542,800
  • Brisbane/Gold Coast – apartment prices up 1.2% to a median $400,000
  • Canberra – apartment prices up 7.6% to a median $439,500
  • Adelaide – apartment prices down -1.3% to a median $380,000
  • Perth – apartment prices up 0.5% to a median $400,000
  • Hobart – apartment prices up 1.5% to a median $313,800
  • Darwin – apartment prices down -10.5% to a median $440,000

Source RP Data & BIS Shrapnel

Quarterly Review October 2017

Share Market Review

The ASX200 started the 2017 calendar year at 5,773 points and has closed the September quarter at 5,681 points. This is a drop of 92 points or -1.59% over the nine month period. The sideways pattern has been a feature of ASX trading since the middle of May. The index has been unable to break out of a rough 100-point range.

The threat of nuclear attack from North Korea has definitely caused the market to stall as well as uncertainties about global economic growth, domestic economic growth and the shambolic style of the Trump administration in the US.

On a stock specific basis, Commonwealth Bank has also weighed heavily on the market over the three months, dropping 9.1% after facing allegations of breaching rules aimed at preventing money laundering.

Also contributing heavily to the index losses over the quarter was Telstra which has dropped from over $5 at the beginning of 2017 to $3.49 as at 29 September as investors continue to fret about the telco’s dividend prospects and the impact from the NBN.

The mining and energy sectors put in solid performances over the September quarter with BHP up 10.7% and Rio Tinto up 5.2%.

In comparison to the Australian Share market, US markets are trading at record levels with the Dow Jones up 24.16% for the 2017 calendar year. If President Trump is successful in getting his tax plan through we should expect to see the US and Australian Stock markets rally.

Economic Update

The Reserve Bank of Australia (RBA) kept interest rates on hold throughout the quarter (as expected) and reiterated their ‘watch and hold’ position for the months to come. September marked 82 months since the RBA last increased the cash rate.

Last month RBA Governor Phillip Lowe announced that rate cuts have come to an end. However, there was no commitment to a rate rise anywhere in the near future.

Although the RBA hasn’t increased rates, the banks have. Almost nine out of ten borrowers with variable rate mortgages have seen an interest rate rise in the past two years. Interest only borrowers have been hit hardest by rate rises in recent months as regulators push for greater use of lower-risk principal and interest loans.

These out-of-cycle rate rises are a reasonable indication of where we can expect rates to go in the coming years; albeit slowly.

Business confidence is up and businesses are beginning to invest again. This coupled with a declining unemployment rate and continued government infrastructure spending is positive reinforcement that our economy is continuing to improve.

If we see growth in wages over the short term, spurring on consumer spending, further positive growth can be expected. Nonetheless, households are still shy to ramp up spending post-GFC, and the high levels of household debt Australians are bearing is still a headwind to further economic growth.

To boost economic growth we really need an increase in wage levels which generally increases consumer spending and tax receipts for the Federal Government’s budget. Unfortunately low wages growth, higher energy prices and a lack of political leadership has seen consumer spending fall.

Property Market Update

CoreLogic’s Accumulation Index looks at the total returns from the housing asset class factoring in the change in the value of the dwelling and the gross rental return from the property.

The CoreLogic Accumulation Index shows that nationally, total returns from housing are starting to ease. The total returns from the housing asset class over the 12 months to August 2017 were 13.2%. Because the return is calculated from value change as well as the gross rental yield, you tend to find that houses have a superior value growth performance while units offer superior rental returns. Over the past year, total returns for houses nationally have been recorded at 13.5% compared to a 12.0% return for units.

Over the 10 years to August 2017, the annual total returns for housing nationally have been recorded at 8.8%, split between 8.9% for houses and 8.5% for units.

Total housing returns have generally been superior in capital cities to regional markets however, in the 2008 and 2010-11 downturns, returns slumped by a greater magnitude in the capital cities. Over the past decade, combined capital city annual total returns have been recorded at 9.3% with returns of 9.5% for houses and 9.0% for units. Over the 12 months to August 2017, total returns have been recorded at 14.0% for houses and 12.3% for units.

Regional market returns have generally not been as strong as those across the combined capital cities. However, some regional areas are enjoying the benefits of buoyant property market conditions due to housing demand rippling outside of the capital city boundaries into regional towns, particularly coastal regions. The Illawarra region has recorded the largest annual increase in regional home values up 15.8% for houses and 14.40% for units.

Regional market returns have generally not been as strong as those across the combined capital cities. However, some regional areas are enjoying the benefits of buoyant property market conditions due to housing demand rippling outside of the capital city boundaries into regional towns, particularly coastal regions. The Illawarra region has recorded the largest annual increase in regional home values up 15.8% for houses and 14.40% for units.

Hobart has recorded the strongest annual growth of all capital cities over the past year and it also has some of the highest rental yields which has meant it has had the strongest total returns. Total returns for houses over the past year have been above 10% in each of Sydney, Melbourne, Adelaide, Hobart and Canberra. For units, double-digit total returns have been achieved over the past year in each of Sydney, Melbourne and Hobart. Units in Darwin were the only capital city property type to achieve negative returns over the past year.

With capital growth now appearing to have peaked and rental yields at record lows it is reasonable to expect a further moderating of total returns over the coming months. The other important thing to consider when looking at total returns is the calculation of the rental income. Although rents are increasing in many areas, the assumption in a gross rental yield calculation is that the property is occupied for 52 weeks of the year. In some parts of the country this is increasingly difficult to achieve and it can eat into the investment returns.

The total returns data, particularly for the past decade, shows why housing investment has been so popular and hit record highs. Returns have been fairly consistent and less volatile than equities however, the ongoing strength and the evidence of a recent slowdown should give investors pause for thought. With mortgage rates starting to increase for investors, record-high levels of new housing supply and value growth slowing, housing investors shouldn’t assume that the types of returns seen over recent years will continue to be replicated going forward.

Source RP Data & BIS Shrapnel

Superannuation Update December 2017

Contributing the Proceeds of Downsizing your Home into Superannuation

On 9 May 2017 the Government announced that from 1 July 2018, individuals aged 65 or over will be able to make a contribution to super of up to $300,000 from the proceeds of selling their home. This legislation has now passed both houses and is awaiting royal assent.

These contributions will not count towards the concessional or non-concessional contribution caps and the individual making the contribution will not need to meet the existing maximum age, work or $1.6m balance tests for contributing to super.

The home sold must have been owned by the individual for the past ten or more years and was the principal residence of the individual.

Both members of a couple can contribute to super from the proceeds of the sale. This means, a couple could potentially contribute up to $600,000 into super using this strategy.

This strategy is beneficial for retirees who can top up their superannuation / pension balances and invest their savings into a 0% tax (Pension Phase) or worst case 15% tax (Accumulation Phase) environment.

Note that this measure will come into effect from 1 July 2018 and is based on the contract date not the property settlement date.

If you are interested in discussing this strategy or your retirement planning in general please contact our Financial Planning Team.

Level One Spotlight – Platinum International Fund

Platinum International Fund

Most of our clients are familiar with the Platinum International Fund, as Platinum is our preferred international equity fund manager.

Whilst we directly purchase Australian shares for our client portfolio’s we utilise a specialist international manager for our overseas exposure. This is due to the many issues that need to be taken into consideration when investing overseas such as Region /Country, Sector, Currency, Specific Stock selection, as well as the execution of share trades.

There are 60 major stock exchanges in the world with a total value of $69 trillion. The Australian Share Market makes up less than 2% of Global markets! Adding international exposure to your investment portfolio provides diversification and opportunities that are not available within the Australian market.

The Platinum International Fund was first established on 30th April 1995 by Kerr Neilson and Andrew Clifford, and they still manage the fund today – some 22.5 years later. Interestingly, both Neilson and Clifford worked together for 20 years prior to this at BT where they had joint responsibility for BT’s international fund.

Over the last 22.5 years the Platinum International Fund has returned an average of 13.2% per annum each year. This is an outstanding long-term performance record, that coupled with the consistency of the management team, gives us a great level of confidence in the future of this fund.

We have summarised some of the key points about the Platinum International Fund below. If you are interested in learning more about this investment please contact our office on 02 4227 6744.

Level One Financial Advisers Pty Ltd. AFSL 280061. The information contained on this website is general information only. You agree that your access to, and use of, this site is subject to these terms and all applicable laws, and is at your own risk. This site and its contents are provided to you on an “as is” basis, the site may contain errors, faults and inaccuracies and may not be complete and current. It does not constitute personal financial or taxation advice. When making an investment decision you need to consider whether this information is appropriate to your financial situation, objectives and needs. Liability limited by a scheme approved under Professional Standards Legislation. Disclaimer and Privacy Policy

Doug Tarrant

Doug Tarrant

Principal B Com (NSW) CA CFP SSA AEPS

About Doug

As founder of the firm Doug has over 30 years of experience advising families, businesses and professionals with commercially driven business, taxation and financial advice.

Doug’s advice covers a wide variety of areas including wealth creation, business growth strategies, taxation, superannuation, property investment and estate planning as well as asset protection.

Doug’s clients span a whole range of industries including Investors; Property and Construction; Medical; Retail and Hospitality; IT and Tourism; Engineering and Contracting.

Doug’s qualifications include:

  • Bachelor of Commerce (Accounting) UNSW
  • Fellow of the Institute of Chartered Accountants
  • Certified Financial Planner
  • Self Managed Superannuation Fund Specialist Adviser (SPAA)
  • Self Managed Superannuation Fund Auditor
  • Accredited Estate Planning Specialist
  • AFSL Licensee
  • Registered Tax Agent
Christine Lapkiw

Christine Lapkiw

Senior Associate B Com (Accounting) M Com (Finance) CA

About Christine

Christine has over 25 years of extensive experience advising clients principally on taxation and superannuation related matters and was a founder of the firm when it began in 2004.

Christine’s breadth and depth of knowledge and experience provides clients with the comfort that their affairs are in good hands.

Christine currently heads up the firm’s SMSF division and oversees a team that provide tailored solutions for clients and trustees on all aspect of superannuation including:

  • Establishment of SMSFs
  • Compliance services
  • Property acquisitions
  • Pension structuring
  • SMSF ATO administration and dispute services

Christine’s qualifications include:

  • Bachelor of Commerce (Accounting)
  • Member of the Institute of Chartered Accountants
  • Master of Commerce (Finance)
Michelle Jolliffe

Michelle Jolliffe

Associate - Business Services B Com (Accounting) CA

About Michelle

Michelle has been with the firm in excess of 13 years and is an Associate in our Business Services Division.

Michelle and her team provide taxation and business advice to a wide variety of clients. Technically strong Michelle can assist with all matters in relation to taxation covering Income and Capital Gains Tax; Land Tax; GST; Payroll Tax and FBT.

Michelle is an innovative thinker and problem solver and always brings an in-depth and informed view to the discussion when advising clients.

Michelle has considerable experience with business acquisitions and sales as well as business restructuring.

Michelle’s qualifications include:

  • Bachelor of Commerce (Accounting)
  • Member of the Institute of Chartered Accountants
Joanne Douglas

Joanne Douglas

Certified Financial Planner and Representative CFP SSA Dip FP

About Joanne

Joanne commenced with Level One in 2004 and has developed into one of our Senior Financial Advisers.

With over 20 years of experience, Joanne and her team provide advice across a wide variety of areas including: Superannuation; Retirement Planning; Centrelink; Aged Care; Portfolio Management and Estate Planning.

A real people person Joanne builds strong long term relationships with her clients by gaining an in-depth knowledge of their personal goals and aspirations while providing tailored financial solutions to meet those needs.

Joanne’s qualifications include:

  • Certified Financial Planner (CFP)
  • Self Managed Superannuation Firm Specialist Adviser
  • Diploma of Financial Planning

Disclaimer & Privacy Policy

Disclaimer

The information contained on this web site is general information only. You agree that your access to, and use of, this site is subject to these terms and all applicable laws, and is at your own risk. This site and its contents are provided to you on “as is” basis, the site may contain errors, faults and inaccuracies and may not be complete and current.

It does not constitute personal financial or taxation advice. When making an investment decision you need to consider whether this information is appropriate to your financial situation, objectives and needs.

Level One makes no representations or warranties of any kind, expressed or implied, as to the operation of this site or the information, content, materials or products included on this site, except as otherwise provided under applicable laws. Whilst all care has been taken in the preparation of information contained in this web site, no person, including Level One Taxation & Business Advisors Pty Limited, accepts responsibility for any loss suffered by any person arising from reliance on the information provided.

Privacy

Level One highly values the strong relationships we have with our clients. The collection of data at Level One is being handled with full and proper respect for the privacy of our clients. The data we collect is handled sensitively, securely and with proper regard to privacy laws. Level One does not disclose, distribute or sell the data we collect from our clients to third parties.