LevelOne Logo
Header Background

Article Archive

Business Brief September 2013

The Power Of ‘One Rule’ In Productivity And Growth

Giving your employees a clear focus on what is to be achieved and how it will be achieved is the most effective pathway to reaching your strategic goals, sharpening your competitive advantage and promoting continuous improvement.

Learn the principle of the ‘One Rule’ that will give your organisation a crystal clear focus on success.

A great educator, Rick Ackerly, shares a story about a great first grade teacher named Kathy who would tell the class at the beginning of the year, “Here, we have one rule: Be Kind”. Her classroom was magical. Having only ‘One Rule’, didn’t keep her from doing other things like homework or cleaning up. The kids got it, and no one argued. Of course, they all wanted to work and play in an environment where everyone is kind. Saying there is ‘One Rule’ gave her leadership a name and her classroom culture a focal concept around which everyone could build something beautiful.

In the business world, the ‘One Rule’ strategy can be referred to as ‘Non-Negotiable Principles’ (NNP). Non-Negotiable Principles translate the company’s competitive advantage (or core competency or ‘winning idea’) into a few actionable statements all employees can understand, relate to, and apply when making daily decisions.

If it doesn’t help employees make decisions, it isn’t a winning idea!

Southwest Airlines defines itself as “THE low-fare airline”. There’s a well-known anecdote about a marketing executive who approached the CEO with customer survey data suggesting that Southwest should add a chicken Caesar salad to their longer flights. The CEO asked, “Will adding a chicken Caesar salad help us be THE low-fare airline in those markets? Because, if it won’t, we aren’t serving any chicken salad!”

This is how having – and more importantly, communicating – a ‘winning idea’ (NNP) helps employees make trade-offs between competing values. And when people become comfortable in applying your NNP, they become so much more productive and confident in the accuracy of their decisions, and they will find more time, capacity and experience to think BIG.

Consider the case of an automotive manufacturer who supplies equipment to several global automotive clients. They operate several production lines which mirror their engineering expertise. But, spot the difference! One production line, for motor company ‘A’, dictates minor changes to the product design every six months, requiring regular changes to tooling, components, servicing and, of course, staff training. The second line, for motor company ‘B’, has a standard process of a normal product life-cycle, or roughly 3 – 5 years. One might expect that line ‘A’ would be thrown into a disarray and stop-start mode of interruptions every six months, making line ‘B’ a more efficient, smoothly running operation that gains economies of scale over time.

But the opposite has been observed. It turns out that line ‘A’ is able to handle not only the required changes more efficiently, but also seems to cope with unplanned disruptions better. At the same time, causal disruptions tend to throw line ‘B’ into much longer periods to find solutions and restart.

Why would this be the case? The answer is: experience in handling change. When change is constant, it is in human nature to adapt to the pace. Employees in handling line ‘A’ are conditioned for change, expect it and have an opportunity to practice change more often.

The strategic power of the ‘One Rule’ principle

Here are some real-world examples of the one-rule principle in action:

  • For one airline, its CEO made the team focus on ‘On-time arrivals’. This simple rule allows everyone to test their actions daily, by asking: ‘Will this choice / decision help us deliver our promise of being an ‘on-time arrivals’ airline?”. If they can’t deliver this; they have no competitive advantage.
  • One aluminium manufacturer made ‘No worker accidents’ the top priority. He knew that to prevent accidents, all employees would have to understand their operations so well that operational efficiencies would be implemented naturally, thereby preventing accidents.
  • In the 1980s, a new director of New York City’s troubled subway system declared: ‘No graffiti’. He knew that eliminating graffiti provided an important, visible victory and would, in turn, lead to other improvements.

Applying the ‘One Rule’ principle

Imagine yourself in this scenario: Let’s say you define your organisation as the “leader in fast turnaround of short-production-run, high quality manufacturing services, globally“. This is your competitive advantage. To become a ‘One Rule’ strategy, it must be applied to all things your organisation does, in every operation. How is this done?

Coach your workforce to know:

  • WHAT your ‘One Rule’ is
  • Understand WHY your business depends on fast-turnaround
  • HOW to apply the ‘One Rule’ to all actions to support this outcome
  • And do so sustainably

Business must first and foremost be sustainable, i.e. all outcomes ideally must be viable in the long run and must be repeatable. It is never a good practice to pour extra resources into a situation when it cannot be sustained every time. At the very least, such solutions should become a case study for others to learn from.

There can be any number of underlying principles for your ‘One Rule’ Strategy to help guide people in making effective decisions: each explained and practiced through coaching.

  • What will help us maintain our standard of quality – profitably / sustainably?
  • What could be changed about this process, or about my activities, to improve ‘fast turnaround’ sustainably?

You can even provide job-function specific questions or extend these questions to the entire workforce to gain broader input of ideas: “In what other markets / for what other type of customers is this value ‘relevant’ and ‘important’ where we can offer our premium service?”

‘One Rule’, clearly identified, communicated and coached consistently, is your strategy for achieving continuous improvement and repeat business success.

The material above was produced byMargaret Manson, Chief Inspirator, InnoFuture. InnoFuture helps organisations build innovation capacity and culture by making their business Vision and strategy an integral part of every job, every day, through Non-Negotiable Principles that guide, connect and inspire people. Find out more: www.innofuture.com.au/collaborate-or-perish.

[Quote]

“Conformity is the jailer of freedom and the enemy of growth”John F. Kennedy

Age Pension Update

Age Pension Rates

New Age Pension rates and Income and Asset Test thresholds took effect from 20th September 2013. Current rates and thresholds are set out in the tables below:

Single (per fortnight)

20th March 201320th September 2013Increase per fortnight
Base Rate$733.70$751.70$18.00
Supplement$61.20$61.70$0.50
Clean Energy Supplement$13.50$13.70$0.20
Total$808.40$827.10$18.70

Couple (each member of couple per fortnight)

20th March 201320th September 2013Increase per fortnight
Base Rate$553.10$566.60$13.50
Supplement$46.10$46.50$0.40
Clean Energy Supplement$10.20$10.30$0.10
Total$609.40$623.40$14.00

Asset Test Thresholds

Family SituationAsset Test Lower Threshold
(Full Age Pension Payable)
Asset Test Cut Off Threshold
(No Age Pension Payable)
Single Homeowner$196,750$748,250
Single Non-Homeowner$339,250$890,750
Couple Homeowner (combined)$279,000$1,110,500
Couple Non-Homeowner (combined)$421,500$1,253,000
Illness Separated Couple, homeowner$279,000$1,382,000
Illness Separated Couple, non-homeowner$421,500$1,524,500

Income Test Thresholds

Family SituationIncome Test Lower Threshold
(Full Age Pension Payable)
Income Cut Off Threshold
(No Age Pension Payable)
Single$156 per fortnight$1,810.20 per fortnight
Couple (combined)$276 per fortnight$2,769.60 per fortnight
Illness Separated Couple, non-homeowner$276 per fortnight$3,584.40 per fortnight

Commonwealth Seniors Healthcare Card (available to persons over age 65)

The Commonwealth Seniors Health Card is subject to an adjusted taxable income test. There is no assets test. To be eligible you need to have an annual adjusted taxable income of less than:

  • $50,000 (singles)
  • $80,000 (couples, combined), or
  • $100,000 (couples, combined, separated by illness)

Quarterly Review September 2013

Market Review

The first quarter of the 2013/14 financial year was very strong. Early September saw the ASX/200 reach its highest level in over 5 years. The market kept pushing and eventually reached a high of 5,307.10 on 27th September before dropping slightly and closing the quarter at 5,218.90. The final result being that the market jumped 416.3 points or 8.67% for the quarter.

Calender year to date the ASX/200 has risen 569.9 points from 4,649 points on 31st December 2012 to 5,218.90. This represents a gain of 12.26% over the nine month period and we are well on the way to posting a great return for 2013!

The key issues affecting markets over the quarter were:

  • Reporting Season; this proved relatively uneventful with companies continuing to be cautious in their forecasts with a key focus on costs and efficiency.
  • Syria; The USA’s threat of a strike on Syria is now on hold
  • The US Fed Tapering; the Fed surprised markets by maintaining its $85 billion per month rate of purchases. Equity markets immediately rallied on the news.
  • The Election; the change in Government has so far been positive for the ASX and business confidence is also improving.

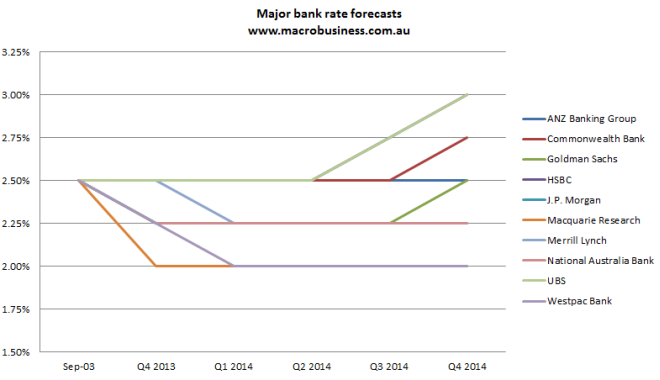
This quarter the RBA provided us with another 0.25% interest rate cut with the official cash rate now sitting at 2.50%. We are expecting another interest rate cut over the coming months however a falling Australian dollar may delay this cut. It should be noted that interest rates are at 40 year lows and mortgage holders need to consider if it is time to fix rates over the coming months.

Our outlook for the Australian Share market is still positive however we expect volatility to continue. Short term these negative periods provide the perfect time to enter the market for the long term investor.

Economic Update

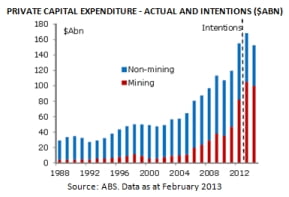
Our economy continues to grow below trend pace. GDP for the first quarter of 2013/2014 was 2.6%; still 0.4% below the 3.0% expected growth rate. Reserve Bank Governor Glenn Stevens says that this lag in growth is “…expected to continue in the near term as the economy adjusts to lower levels of mining investment.”

The RBA cut rates in August by 0.25, which sees the cash rate at 2.50 currently. The September and October meetings saw rates kept on hold, however they have left room for more rate cuts. Governor Stevens stated “The Board will continue to assess the outlook and adjust policy as needed to foster sustainable growth in demand and inflation outcomes consistent with the target.” It was noted that inflation remains stable at this time.

Unemployment has climbed to its highest level in four years to 5.8%. Full-time jobs declined by 2,600 in August and 8,200 part-time jobs were lost. Conversely the number of hours worked increased by 1.1 million hours to 1.65 billion hours. This increase can largely be attributed to the poor labour force sentiment and growing fear of further job losses across the retail, mining and resources sectors.

The Australian dollar rose from US$0.92 on 1 July to US$0.95 at 20 September but has since again declined to US$0.94. This is around 10% below its level in April 2013 however. To stimulate economic growth the Aussie dollar needs to fall further. With the unrest occurring in the US government currently, the US dollar has not experienced much volatility at all. This is largely due to the sentiment that the shutdown will be short-lived.

On a positive note, consumer confidence rose 4.95% in September. Consumer confidence has risen each month over the quarter and is 12.7% higher than this time twelve months ago.

Property Market News

Property prices and the risk of a property bubble seem to be dominating the press headlines at present so we thought we’d take this opportunity to give you the facts.

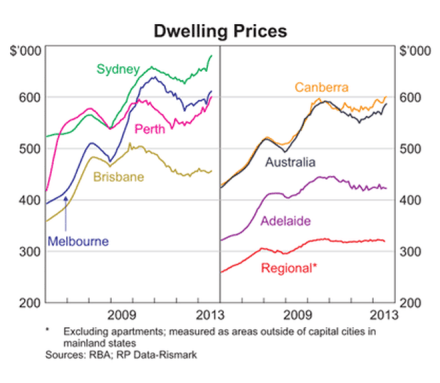
Australian capital city home values have hit a record high, driven by accelerating prices in Sydney and Melbourne. Sydney’s median house values rose by 2.5% in September, and Melbourne gained 2.4%. Still, house values fell in every other major city except Adelaide during September, meaning aggregate capital city home prices rose by 1.6%, RP Data-Rismark figures show.

“We haven’t seen market conditions this strong since April 2009 for Sydney and May 2010 for Melbourne,” RP Data analyst Tim Lawless said.

For the record, Sydney house prices are up 8.3% over the past 12 months. They were up only 1.2% last year and were down 2.4% in 2011. Over the past five years, home prices have lifted at an average annual rate of 3.4%, in line with wage growth.

To create a property bubble, property prices need to be increasing at an unsustainable level over an extended period of time. A serious problem is created when the party comes to an end and we get a major crash in housing prices.

The three key issues that could affect the sustainability of current prices are:

  • Rising interest rates
  • Rapidly rising unemployment
  • Oversupply of housing stock

While we currently have record low interest rates, even a few interest rate rises over the coming years will still see us at historically low levels. Given this we do not expect interest rates to be a trigger point.

Unemployment has been increasing however if the new Government can create an environment that is better for business then this shouldn’t be of concern. Business confidence has improved but the question will be – is it enough to stabilise employment levels.

Over supply appears to be many years away. The GFC put a screaming holt to most developments as finance suddenly dried up. Lending today for land development / subdivision and for residential housing is running at approximately half that of the peak in December 2008 and the figures have changed little over the last twelve months.

Population growth figures released by the NSW Department of Planning and Infrastructure indicate that Sydney will need another 100,000 more new houses than previously planned for, according to Urban Taskforce.

Clearly we should always be alert to signs of unsustainable growth in home prices. However at present we believe there is no need for undue concern. Sydney home prices are lifting in response to low interest rates after a period of under-performance.

SPC Boss Seeks More Support to Aid Growers

This was an article written by Sue Neales for The Australian on 8th October 2013. Next time you’re at your local supermarket maybe think about picking up a can of SPC fruit – you’ll be supporting Australia.

STRUGGLING Australian food company SPC Ardmona has accused the federal and Victorian governments of hypocrisy in failing to support Australian farmers and food businesses.

Peter Kelly, managing director of the only major remaining fruit cannery in Australia, is appalled no government-owned institutions such as hospitals, jails, parliaments, old people’s homes or defence force barracks are instructed to buy Australian-grown and made food as a priority.

Mr Kelly, who will meet federal Industry Minister Ian Macfarlane today to discuss a $25 million federal rescue and restructuring package for SPC, wants politicians to start matching with action their rhetoric about Australia’s future viability as a food bowl for Asia.

He says the Goulburn Valley business, owned by Coca-Cola Amatil, will not survive without government financial and purchasing support in the form of procurement policies focusing on locally grown and made food.

“The biggest win for us would be to get Australian health departments – they run the hospitals and care centres – to buy Australian fruit, not imported cans; yet our market share, and that of all Australian products, in those institutions is very small,” Mr Kelly said. “Instead, they are some of the biggest importers (of processed fruit and food).

“Our own government is not buying our products, and it makes me very angry . . . The Australian government should be supporting Australian farmers and businesses; how can we ever become a fresh and processed food bowl for Asia otherwise?”

Mr Kelly also wants the government to consider including canned SPC fruit in its foreign aid donations. He asks why Australia gives cash aid to countries in Africa, the Pacific and Asia, which is then used to buy food to alleviate hunger, when Australian grown and processed fruit could be given instead.

The SPC chief says every small policy change that boosts demand for traditional SPC canned fruit products, as it shifts to a more modern production focus based on snack foods, soft serves and fruit ice cream, will help protect the livelihoods of farmers growing peaches, pears and apricots in the Murray-Goulburn Valley, as well as factory jobs.

“We are at five minutes to midnight; it is time for us to play hardball and point out everything that is not right and fair in the way farmers and the food industry is treated in this country,” he said.

Since supermarket giant Woolworths stopped buying South African cans for its home-brand Select tinned fruit lines in July and switched to SPC Ardmona products, it has sold 890,000 tins of Australian fruit in its stores.

Sales of the canned fruit, which is prominently identified as Australian-grown, have increased by 38 per cent nationwide.

In Woolworths stores in the Goulburn Valley and northern Victoria, where most of the fruit is grown and where almost every family has a member who at some time has worked at one of the three SPC plants at Shepparton, Kyabram and Mooroopna, or as a seasonal fruit picker, demand for the Australian cans has more than doubled.

The jump in sales has enabled SPC to increase its orders for fruit from the 118 local orchards it still has contracts with by 15 per cent, despite Woolworths’ Australian-only policy not coming into full effect until late next year.

Before Woolworths’ move, and a similar commitment by the Aldi chain, imported canned fruit had captured nearly 60 per cent of private-label or home-brand sales. Coles has always sourced most of its home-brand fruit cans from SPC.

Mr Kelly said the selling power and market domination of the supermarkets was so strong that SPC had little choice but to manufacture as much of the private-label brands for the major retailers as it could.

But with the fall in the Australian dollar and “real commitment” from Coles and Woolworths executives, he is confident that the days of tinned fruit from China selling for $1.49 a tin as a supermarket private label, instead of equivalent SPC cans priced at $3.50, are gone.

Business Brief December 2013

From Bland to Brand

Unfortunately, the term ‘brand’ is an abused and confused term. ‘A leading brand’ is distinctly different from ‘a well-known company’ and ‘creating a new brand feel’ is downright misleading when in fact the company logo and typeface is all that is being changed.

So just what is a brand? Why is it important to you and how do you go about creating your own brand?

Building a brand

There are many definitions of a brand: a brand is what people associate with you when they think about your company, service or product. Slightly less worthy but still not quite there is: a brand is what makes people run after it.

The definition I’d commend to you is: a brand is a promise consistently delivered.

In other words, in any dealings with your organisation, your public’s experience should be predictable and positive on an emotional and practical level. Whether you like it or not, your company is already a brand. It may not be exactly what you want, it possibly isn’t formed, but each and every day in all your commercial dealings you affirm what your brand stands for.

So why is a strong brand so important?

In essence, people buy brands, not products.

It’s a well told marketing truth that explains why even such uncomplicated and commodity products and services such as utility suppliers, bottled water manufacturers and telephone directory enquiry services have all spent a great deal of time ‘and not a little money’ in positioning themselves as distinct and appealing brands in a very cluttered market place.

It wasn’t that long ago that buying a bottle of drinking water let alone a specific brand was an anathema. It wouldn’t have made sense and any rational person would have baulked at the prospect. And there’s the rub, we aren’t exclusively rational in our behaviour.

And thank goodness for that. What a frightening and predictable world it would be if we applied Vulcan-like logic to the decisions we face in life. Luckily we all possess a healthy quotient of irrationality that affects our behaviour, which makes life more interesting and marketing more challenging.

Brands, or more accurately brand strategies, are geared to plug in to human frailties and idiosyncrasies. In truth, the most successful brands are specifically created to help consumers choose a product or service on other than rational criteria.

The logo that adorns your shirt’s breast pocket, the fridge door or that little leather handbag – it’s all about reaffirming your personality.

Never underestimate the power of a brand

There is a wealth of empirical evidence that demonstrates the value of a strong brand to a company. On the one hand, it will facilitate better distribution and help maintain price differentials. In pure accountancy terms, the brand value is classed as an intangible asset but one that in some cases is worth more than the bricks and mortar that constitute the company that built the brand in the first place. The Coca-Cola brand alone is worth in excess of $70 billion.

So how do we create a brand?

Your company will have created brand associations purely by existing. No doubt through experience or research or both, you’ll have covered a niche that’s right for you. Now the main, and sometimes painful task, is to be honest about your company and your aspirations for it.

Most brand strategies reflect inherent truths. Find out what your customers, suppliers and distributors all really think of you. Build on the positive and rectify the negative. It’s then time to define your brand positioning where, in the competitive marketplace, your company will sit. What are the marketing gaps and opportunities and will you feel comfortable occupying them?

Time for another maxim: never underestimate the consumer.

In essence, if you pretend to be something you’re not, then you will be found out. Working to your strengths, backed up by the acknowledged reality is the way to go.

As a guide, here is a five point checklist for ensuring the ultimate brand proposition is likely to thrive:

  1. Credible – Is what you say about yourselves believable?
  2. Sustainable – Can you then maintain the values you’re promoting?
  3. Relevant – Does what you’re claiming strike a chord with your audiences?
  4. Motivating – Will your brand proposition be sufficiently potent to generate action?
  5. Differentiating – Does what you say set you apart from your competitors?

A word of caution

It is always tempting to start building a brand on what is actually an operating strength. Unless these strengths can be translated into meaningful consumer benefits, they should be discarded. For example, characteristics and attributes like quality, tradition, service or, saints preserve us, craftsmanship, carry the faintest whiff of staleness. Agreed, they’re fine and necessary means to an end, but consumers are a canny and unforgiving lot, who want to know what’s in it for them.

Let’s take a hypothetical example where an independent kitchen manufacturer YXZ Ltd, produces a range of cutting-edge, contemporary and state of the art products. Its brand positioning might be around, say, ‘exclusivity’.

As a brand proposition, we need to be more engaging, so perhaps ‘be adventurous with design’ is where there’s scope.

Straight away there are connotations of a prestigious, premium and, of course, exclusive brand.

Brand power

Finally, the headline in the advertisement featuring an example of YXZ’s products could read “Just how daring are you in the kitchen?”

You will polarise views, but you will also win staunch advocates who share XYZ’s sense of edginess.

Your audience will at least know what you stand for.

Author Credits

Nick Fairburn, Client Services Director at Factor 3 (http://www.factor3.co.uk/), Branding (http://www.factor3.co.uk/our-work/branding),

advertising (http://www.factor3.co.uk/our-work/advertising), digital marketing (http://www.factor3.co.uk/our-work/digital), Design

(http://www.factor3.co.uk/our-work/design), brand strategist (http://www.factor3.co.uk/blog/from-bland-to-brand).

[Quote]

“Only the wisest and stupidest of men never change.”Confucius

Market Wrap Up October 2013

Market News

The Australian Share Market performed very strongly over the month of October, with the S&P/ASX200 benchmark index increasing 206.6 points or 3.96%.

The ASX/200 started the 2013/14 financial year at 4,802.59 and has now risen to 5,425.50; a gain of 622.91 or 12.97% over the four month period. This is an outstanding result so far.

Further this means that the ASX/200 has risen 32.5% since 1st July 2012, but remains even at these levels 21.06% below the market high of 6,873.20 on 1st November 2007.

The Financials (ex REIT’s) was the strongest performing sector for the month of October, posting gains of 5.9%. Of note within this sector was the performance of Macquarie Group which outperformed the index and returned 6.35% to close at $50.95 on 31st October 2013. Some of our portfolio management clients were fortunate enough to buy into this stock in the $36 – $40 price range earlier this year when it was initially added to our recommended model portfolio and have enjoyed the gains ever since.

The Healthcare sector also performed well increasing 4.5% in October. Within this sector one our portfolio darlings CSL Limited jumped 8.59% over the month to close at $69.50. Twelve to eighteen months ago the Healthcare sector was heavily out of favour, stock prices were low and we were recommending buys in stocks such as CSL and Primary Healthcare. The last twelve months has seen a surge in this sector due to the defensive and reoccurring nature of earnings. Most of our portfolio management clients would hold at least one healthcare stock and hence are currently enjoying the returns within this sector also.

The energy sector was the worst performing sector increasing only 0.2% for October.

The US shutdown failed to put a damper on equities, with initial weakness early in the month being shrugged off and producing a strong rally for the backend of October. The rally was broad based, with every major sector and almost every country’s stock market posting gains – Japan being the notable exception. The MSCI US index increased 4.4% in October not bad for a country who spent half the month in a Government Shutdown!

Spotlight on the Banks

As our portfolio management clients are well aware our portfolios have been heavily invested in the banking sector over the last few years. For regular readers you will know that we have also been highlighting the grossed up dividend paid by the “big 4” which has been roughly double term deposit rates for some time now. Below is a quick summary of how the shares have tracked and the current income:

StockShare Price 31stOctober 2011Share Price 31stOctober 2012Share Price 31stOctober 2013Current Grossed Up Dividend Yield
ANZ$21.68$25.45$33.846.93%
CBA$49.27$57.75$76.086.83%
NAB$25.70$25.79$35.317.69%
Westpac$22.32$25.51$34.298.08%

Now the question we seem to be getting asked is are the banks over valued? Well there are arguments for both sides so here’s a quick summary.

Strong Capital Growth

Share price movement of the big four banks from 2009 to 2013 so far:

CBA +155%

ANZ +101%

WBC +93%

NAB +68%

Yield

The “yield trade” or chase for yield has been a key reason why banks and high yielding assets have rallied over the last few years. With interest rates falling domestically and globally, investors have turned to assets with high yields.

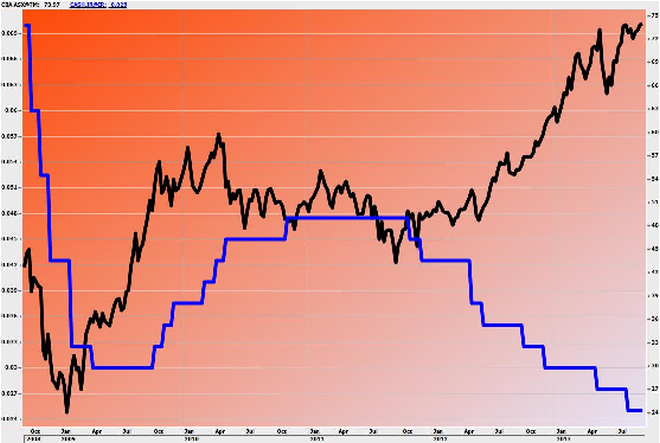
As you can see from this chart of CBA (black line) and the cash rate (blue line), the two are inversely related. That is as cash rates have been falling, CBA’s share price (as well as many others) has been rising.

3 keys to potential negative reaction in bank share prices

  1. Bond prices fall, yields rise
  2. Domestic economy slows
  3. $A continues fall

Bond prices fall, yields rise

As interest rates rise, high yielding investments will be less attractive to investors. Our view is that interest rates will be on hold for the entire 2014 calendar year.

Domestic economy slows

The big four banks are still highly leveraged to the domestic economy. If we start to see the domestic economy struggling, especially the housing market, expect this to impact on banks bad debts and profitability. At the moment though, the opposite is true with relatively low unemployment rates, rising mortgage and construction approvals as well as record auction clearance rates particularly in Sydney and Melbourne.

$A continues to fall

If the $A falls significantly, that will discourage international investors from investing in the Australian market. International investors benefit from a rising $A while invested over here.

Conclusion

The yields on offer are far more attractive than the 3.5% being offered for term deposits and for long term investors, especially those requiring income from their investments the banks are still an attractive option if weighted correctly within your portfolio.

While bank valuations are rising, they can remain and rise above these levels for extended periods of time. A key reason why banks have performed so strongly is a relatively strong domestic economy (no recession in over 22 years) and falling interest rates.

While we continue to monitor economic conditions and the bank valuations may fluctuate we believe that they are an essential part of any long term portfolio. Trying to pick short term fluctuations more represents gambling than investing for the long term.

Seminar Wrap-Up

Business Brief March 2013

The Seven Deadly Sins Of Buying A Business

Are you looking to buy a business? Perhaps you are a business owner looking to snap up an additional business or are craving an escape from the rate race. Either way, there are seven sins all potential purchasers must avoid.

1. Love

It’s easy to put on rose tinted glasses and fall in love with a business.

Whilst it’s important that you love what you do, when buying a small business it’s vital to separate fantasy from reality and look at the cold hard figures.

The tough love comes when you have to place head over heart…and make the decision on whether or not to proceed.

2. Dishonesty

We all go into things with the best of intentions, but can you see yourself in the business in six years or even six months’ time? It’s hard to stay passionate forever, but if there is any danger of you having a change of heart it’s a sure-fire way to kill your business stone dead.

So whatever you do, be honest with yourself.

3. Ignorance

Would you employ someone to fly a plane without training? No! So would you expect someone to be able to run a business with no knowledge of the business’s industry? Believe it or not countless numbers of people buy small businesses without any experience. Ignorance is bliss anywhere but in a small business! If you want to run a book shop go and work in one first, if you want to run a restaurant learn to be a waiter.

If you want to fail, walk blindly into a small business – the bliss will fade pretty soon!

4. Greed

If the first thing you look for in a business is the net profit, a world of disappointment awaits you.

You must view the business in totality – how it fits with your lifestyle, how well you are suited to it and how it will work for you in the future. Money is a drug that can make you happy, but it will only numb the pain temporarily if you aren’t doing something you enjoy.

5. Narcissism

I once knew a small business owner that bought a chain of cafes because he thought it would make him look like Jamie Oliver and help him to pull chicks. It didn’t work, and after six months neither did his chain of cafes.

Everyone thinks it’s cool to run your own business, but if you’re doing it to pamper your ego, you’re doing it for the wrong reasons.

6. Sloth

Finding a good business is hard. Finding a lemon is really easy! Sticking your head in the sand and not performing rigorous due diligence will lead you straight down Lemon Street to the best lemon in town. What will save you from buying a lemon is if you are stringent with your research. Get out and ask questions, do surveys, speak to neighbouring businesses, talk to the council.

Get a tight fisted accountant and an anally retentive lawyer (that won’t be hard). You can never do too much research when buying a small business.

7. Trust

“Oh the vendor told me it’s one of the best businesses he’s ever seen”, “They don’t have proper accounts because they make so much money in cash”…beware! The vendor and the agent are not your friends, they are out to sell a business and this should be remembered at all times.

Family and friends, whilst appreciated for their loving support, will only say nice, encouraging things to you; so please don’t buy a business based on what your mum saw on Dragons’ Den.

The material above was produced by The Process Ninja, Craig Reid. He helps organisations large and small to reach their potential by improving their processes and procedures. His mission is to save the world, one process at a time.

Fee for Service versus Commissions: What’s the Difference?

Fee for Service is exactly what it sounds like: you are charged a fee for the service you are provided. This fee could be calculated upon an hourly rate, be a percentage of your assets under management or be a fixed fee agreed upon for the service sought. In any instance, a Fee for Service arrangement with your adviser ensures the utmost transparency and honesty.

Another method financial advisers can be paid is via commissions. These commissions are in most cases paid by the product provider and not ‘directly’ paid by you.

All financial advisers have a responsibility to act in their client’s best interests; however this has long been abused by a small number of advisers. This abuse has most certainly been fostered by the payment of commissions and volume bonuses by financial product providers. Product providers often inflate their commissions to motivate advisers to invest heavily in their products. Similarly, the providers may also offer a ‘volume bonus’ to incite the adviser to invest many of their clients into the product offered.

This remuneration structure can see investors stung by advisers lining their own pockets or ignoring whether the product is appropriate for the individual investor, which could result in financial loss.

Level One does not accept commissions and will always rebate 100% of any commission offered back to our client, where possible. The only exception here is commissions generated via some personal insurance products. All fees that we receive for the service we provide to you are clearly disclosed and discussed. We don’t hide our fees.

We instead structure our primary fee arrangement around managing all of a client’s financial affairs. Many of the services we perform for our clients depend on a comprehensive strategic plan that goes beyond investments. Trying to answer one issue in isolation can be difficult; hence our services strive to be more holistic.

The methods we use for charging fees are hourly rates, fixed fees or as a percentage of assets under management and depend on the task at hand

By adopting this fee structure we are not bound to provide you with specific products and we are not aligned with any product providers. This independence is further enforced by the fact that we have our own Australian Financial Services Licence and are not dictated to by a large branded dealer group. Instead you get the most appropriate advice for your circumstances – not ours. You can also clearly identify your fees at any time which promotes the highest level of transparency.

Centrelink Update: Deeming Rates

The Minister for Social Services has announced a reduction to the deeming rates reflecting lower returns available to income support recipients from financial investments.

From 4 November 2013 the deeming rates will be:

Deeming rateSingle PensionerPensioner Couple
2%First $46,600First $77,400
3.5%Above $46,600Above $77,400

Deeming rates are set to reflect returns on investments available to pensioners and other income support recipients. It recognises that many pensioners and social security recipients who also rely on own-source income have been adversely affected by the global economic downturn.

Means tested part rate income support recipients paid under the income test, with financial investments mainly in term deposits, shares, managed investments and other accounts, may receive an increase in their pension payments, to reflect the reduction in their assessable income. This applies to both Centrelink and Department of Veterans’ Affairs means tested recipients.

Clients in aged care that pay income-tested fees may have lower costs as a result of the low deeming rates.

The Importance of Disclosure: Insurance

Whenever you apply for an insurance policy, you have a Duty of Disclosure to the insurer under the Insurance Contracts Act 1984. This means that you must disclose every matter that you know, or could be reasonably expected to know, to the insurer which is relevant to their decision as to whether to insurer you or not.

Relevant matters are:

  • Past and current health issues;
  • Relevant details about your occupation and the duties you perform;
  • Lifestyle issues, such as pastimes and activities that may be considered dangerous;
  • Relevant family medical history;
  • Anything else that may affect your eligibility for insurance.

The insurer uses the information you provide in your insurance application to determine whether they are willing to take on the risk of insuring you or not. In some instances where you are seen to have a higher level of risk than normal, the insurer may impose a loading or exclusion on your policy.

  • A loading means that the insurer will offer you the insurance applied for but you will pay a higher or loaded premium. A loading may apply to persons that have significant health issues.
  • An exclusion means that the insurer will offer the insurance as applied for but will exclude an activity or issue. This means that if you make a claim for the excluded item they will not pay your claim. Exclusions may apply for people that have dangerous pastimes.

Non-disclosure can result in the insurer not paying out your sum insured in the event you need to claim. This can be devastating when you have paid your premiums all along to be denied your claim.

Recently we had a client make a claim on a policy, that was established many years ago, and the insurer denied the claim due to non-disclosure of their full medical history. The claim was denied upon the insurance company obtaining the insured’s past medical files and identifying that relevant information was omitted in the initial application.

The insurer stated that if they had of known about the medical history they would not have offered the insurance under the same terms, resulting in the insured being denied their claim.

To avoid this outcome you should always disclose all relevant information to your insurer. This applies to the initial application as well as an application for additional cover, applications to increase or reinstatements.

Superannuation Update November 2013

The recent change in Government has spurred a decision to abandon some of the previous Government’s superannuation proposals. We have detailed below the changes announced to date:

Increase in Superannuation Guarantee Contributions – Delayed

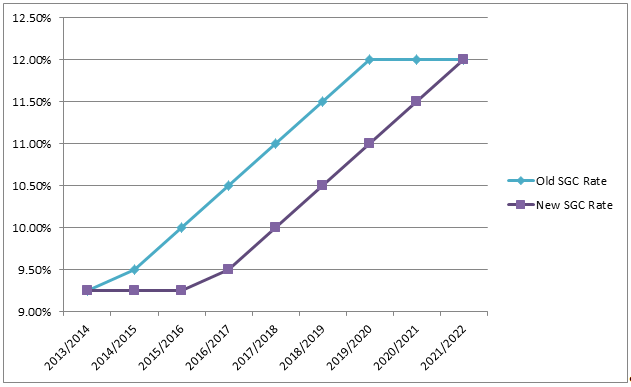
The previous Government put into place a stepped increase in the compulsory Superannuation Guarantee Contributions (SGC) for employees, which saw employees receive 9.25%, an increase of 0.25% in the 2013/2014 financial year. Another increase of 0.25% was to be expected in the 2014/2015 financial year, with 0.50% increases in each year thereafter to reach 12% by 2019/2020.

The Coalition Government has delayed the increases to SGC contributions by another two years. This will see the SGC rate remain at 9.25% for the 2013/14, 2014/15 and 2015/16 financial years, with the SGC reaching 12% in 2021/2022. The following graph illustrates the SGC increase schedule:

Contribution Caps – Retained

An important aspect to superannuation which was not changed by the new Government was the increased concessional contribution cap for those aged 60 and over in 2013/2014 and 50 and over in 2014/2015.

  • From 1 July 2013 taxpayers aged 60 and over will have a $35,000 cap, and
  • From 1 July 2014 taxpayers aged 50 and over will have a $35,000 cap.

Tax on Pension Earnings – Scrapped

A key measure affecting superannuation which was abandoned was the proposal which would have taxed people’s superannuation pension earnings above $100,000 in the pension phase. This measure was due to start on 1 July 2014 and would have applied to all existing superannuation investments.

This proposal to tax pension earnings was going to be very complex and difficult to administer for superannuation funds. In light of this, the new Coalition Government chose not to proceed with this measure.

Excess Contributions Tax – Retained

The new Excess Contribution Tax (ECT) regime for concessional contributions will proceed as announced by the previous Government. This will allow taxpayers that have exceeded their concessional contribution cap after 1 July 2013 to withdraw the excess contribution from their superannuation fund with the excess contribution being taxed at the taxpayer’s marginal rate.

Low Income Superannuation Contribution – Scrapped

The Government confirmed that it will repeal the Low Income Superannuation Contribution (LISC). The LISC was a government contribution to people earning under $37,000 per year that ensured that they would not pay more tax on their compulsory superannuation contributions than they do on their income. This contribution will no longer be available from the 2013-14 income year and onwards.

Further announcements are expected and as always we will keep you informed. Should you have any queries please contact us.

Market Wrap Up November 2013

Market News

The Australian Share Market tracked back slightly over November following a very healthy run since the start of the financial year. The S&P/ASX200 benchmark index lost 105.4 points to close at 5,320.1, which is down 1.94% for the month of November.

The result so far for the 2013/14 financial year is still positive with the market up 517.51 points or 10.77%. This is a great result over a five month period.

Most sectors posted small negative returns for the month of November, the exception being the Financials (ex REIT’s) sector which posted gains of 0.2%. Macquarie Group was again a standout performer within this sector increasing 8.3% for the month.

The energy sector was the worst performing sector again this month dropping -6.3% for November. The biggest detractor here was Worley Parsons who wiped 25.9% off their share price following a profit guidance downgrade.

Globally equity markets generally rose during November. The Japanese market was the best performing major equity market and the US repeatedly made new record highs during the month.

Back in 2007 the US Dow Jones index reached a high of 14,164.53 (on 9th October 2007). The Dow only returned to this point in March 2013 and has been gradually reaching higher to finally break through the 16,000 point level and reach 16,097.33 on 27th November 2013.

So while the US Dow has now clawed back all losses from the GFC and is now in positive territory once more, it’s interesting to note that the Australian share market is still down 22.6% from the market high from 1st November 2007 (6,873.20).

2014 Outlook

  • UBS has released their 2014 outlook for 2014 please find below a summary of their report.
  • UBS target an ASX200 level of 5,700 by year end 2014. This represents a potential return of 11.5%.
  • UBS have forecast the Australian dollar to trade around $0.85 by year end 2014.

Key Themes

  • Housing related stocks look attractive as the cycle continues to strengthen.
  • US dollar exposed stocks still appear attractive given expectation for the Australian dollar to depreciate further.
  • Retain a cautious outlook on the mining services sector, we note that value can still be found here but not for the faint hearted.
  • Banks look somewhat expensive based on conventional valuations however we are still attracted to this sector given the high dividend yields.
  • Overweight in resources and energy following improving conditions.

Downside Risks for 2014

  • The Fed.
  • The Yield Trade.
  • The Australian Dollar.

Australian equities are relatively interest rate sensitive given both the domination of the financial sector and the generally high dividend payout ratio. If the US decides to withdraw QE stimulus faster than expected this will flow through to domestic bond yields and likely pressure the valuations of high yielding stocks, particularly the banks.

The Australian dollar may also come under pressure in this scenario, hurting international investors, though this should be argued to be a medium-term positive for the economy and earnings cycle.

Upside Risks for 2014

  • Further P/E Expansion.
  • Australian dollar earnings kick.
  • Domestic revival.

Upside risks for Australia may come from on-going P/E rerating presumably on the back of global interest rate backdrop, combined with subdued but acceptable economic growth. P/E’s in the range of 15 – 16x is not implausible.

Another positive driver could be the lower Australian dollar (in the $0.80 – $0.85 area), producing positive earnings surprise and improving business spending. This would prove a negative for overseas investors.

Finally positive domestic economic surprise driven by the housing sector could spur a drawdown in our high savings rate and drive a domestic earnings surprise in banks and domestic revival. However this may bring the RBA into play and also limit the Australian dollar downside.

2013 Tax Time

It’s tax time again!

Another financial year has passed and your 2013 income tax return is now due.

As with previous years, we have prepared this summary with the aim of making this annual event as efficient for you as possible. This summary should act as a checklist of items to consider before making an appointment to come in and see us. Whilst there have been no dramatic changes to our tax system from the previous year, there has been some tinkering relating mainly to tax offsets.

Income

PAYG Payment Summaries Previously known as Group Certificates and issued by your employer.

You should have a separate summary for each job you held during the year. These payment summaries should include any payments received in relation to the Paid Parental Leave (PPL) scheme which began on 1 January 2011.

Allowances, Directors Fees etc

Include consulting fees, short casual jobs where no tax was deducted, bonuses and allowances, income from income protection and sickness and accident insurance policies etc.

Australian Government Payments and Allowances

Many Government payments are tax free though some will have tax implications including Newstart allowance, Austudy etc.

Employment Termination Payments (ETPs), Pensions and Lump Sum Payments.

These are specific statements that will be issued by your employer on termination of employment or by your super fund.

Interest

Include interest earned from all bank accounts you held during the year. You can usually find annual interest received on your June or July bank statement and/or your online banking facility.

Dividends

Include details of all dividends from public companies including dividends reinvested.

Trust and Partnership Distributions

Include any distributions you may have received from managed funds, in particular the ‘annual tax summary’.

Employee Share Schemes

Include details of any shares you received from the company you work for including the number, value and date of shares received. Also include copies of any tax advice provided by your employer when you received the shares.

Sale of Investments

Did you sell any investments during the year? If so, please include details of the original purchase date, number of shares/units purchased, amount paid (including brokerage), additions to your investment i.e. dividends reinvested, and sale details. See section below for property investments.

Foreign Income

Foreign income rules changed on 1 July 2009. Please include details of any income you received from overseas including investments, employment income, pensions etc.

Other Income

Any other income received you think may be relevant. It is better to bring something you don’t need than have to drop it off later.

Other items

Personal Details Changes

Please include any changes to your name, address, contact details marital status etc.

Private Health Insurance

You should receive an annual statement from your health insurance company (if applicable) which contains all relevant details for your return.

HECS and HELP Debts

You should receive an annual statement from the ATO detailing debts owing which we will need to include within your return.

Superannuation

Please provide details of any extra superannuation contributions you made (or were made on your behalf) other than the standard 9% Super Guarantee by your employer.

Spouse Details

Tax rebates and governments benefits are now assessed on combined family income of you and your spouse. Please ensure we have all the relevant details of your spouses income when we complete your return.

Child Support

Please provide details of any child support you have paid during the year.

Deductions

Motor Vehicles

There are several methods for calculating motor vehicle deductions. By providing the following information, we can determine which is the best method for you:

  • Details of actual expenses i.e. fuel, rego, insurance etc;
  • Details of work related trips i.e. frequency, distance travelled, where from and to, dates etc (please note, this should not include your daily commute to and from work);
  • Make, model purchase price and purchase date of your car;
  • Any log books you may have kept and/or or odometer readings taken during the year.

Other Travel

Include travel such as train fares, taxis, car hire, flights etc related to your work which you paid for (please note, this does not include the cost of your daily commute to and from work).

Clothing

Include details of the cost of any clothing with company logos, occupation specific clothing (e.g. nurses and chefs uniforms) and any protective clothing e.g. work boots, sun glasses, hard hats etc.

Telephone & Internet

Include details of any work related use of your home phone, mobile phone and internet including any usage of diaries.

Self Education

Include the cost of formal courses and qualifications from TAFE, university etc which are related to your work. Also include the cost of textbooks, stationery, computer, phone, internet and travel related to your education.

Tools and Supplies

Include details of all tools, supplies and consumables you may think are relevant to your occupation which you have paid for personally. We can then decide which are deductible.

Home Office

If you work from home and have a dedicated office space, you may be able to claim a proportion of your household expenses such as heating, lighting, etc as well as depreciation on home office furniture and equipment including computers.

Donations

Include all donations of $2 or more to an approved organisation (your receipt will usually indicate the whether or not you can claim a deduction).

Other Items

Other common deductions you may wish to include union fees, subscriptions to professional or trade associations, seminars and conferences, reference material including books, magazines and journals, income protection insurance and tax agents fees (including travel to and from your tax agent’s office).

Important Note

Tax Records

Taxation legislation places the responsibility of keeping all records related to your income tax return with you the taxpayer. It is your responsibility to keep all receipts, statements and other records for a minimum of 5 years.

Refunds

From 1 July, 2013, the Australian Taxation Office has announced that individual tax refunds need to be deposited into an Australian bank account when lodging via the electronic lodgement service (ELS). Therefore, individual income tax returns will require bank account details including BSB and account number to be entered when lodging using the ELS, where a refund is expected. Joint accounts and trust accounts are acceptable. The Australian Taxation Office will no longer issue refund cheques. You will be required to provide this information to us at the time of preparing your tax return where a refund is expected.

Tax Offsets

Net Medical Expenses

Applicable if you incur out of pocket (i.e. after Medicare and/or private health insurance reimbursement) medical expenses of more than $2,120 during the year. However, with the introduction of a new income test from 1 July 2012 ,if your adjusted taxable income exceeds the threshold of $84,000 for singles and $168,000 for families the out of pocket medical expenses threshold increases from $2,120 to $5,000 and the rate of tax offset will decrease from 20% to 10%. Note: The family threshold increases by $1,500 for each dependent child after the first.

Dependent Based Rebates

Various rebates are available which are based on your dependants i.e. spouse, children or people you care for (your or your spouse’s parents or an invalid relative). In order to calculate if you are eligible, please include details of all dependants including dates of birth and any income your dependants earned during the year.

Other Tax Offsets

Other tax offsets may be available in the following circumstances:

  • You made super contributions on behalf of your spouse;
  • You live in a remote or isolated part of Australia;
  • You served as a member of the Australian Defence Force or a United Nations Armed Force.

Rental Properties

Rental properties are a particular focus of the Australian Taxation Office and care must be taken to ensure all deductions are reported correctly. Our property experts can guide you through the various income and deductions you need to report if you can provide us with the following information:

Rent Received and Commissions Paid

Include your annual rental summary from your real estate agent or property manager.

Interest Expenses

Include loan statements and/or online banking summaries showing total interest paid during the year.

Council & Water Rates

Include statements issued annually or quarterly by local councils.

Strata Levies

Issued by the body corporate and may include annual levies and ‘sinking fund’ costs.

Land Tax

Issued annually by the Office of State Revenue on land holdings over a certain value.

Repairs, Maintenance, Improvements

There are very specific tax rules related to repairs, maintenance, replacements, capital costs, renovations, improvements etc. The best approach is to provide as much detail as possible for each cost for which we can then determine the appropriate tax treatment.

Travel

You can claim the cost of travel to your property for inspections and repairs.

Property Purchases and Sales

The most important information for property purchases are the sales contract and the settlement statement. Other information includes:

  • Legal fees;
  • Inspection fees;
  • Sales commissions;
  • Advertising costs;
  • Stamp Duty.

We trust that this checklist has been useful and we look forward to hearing from you soon. Please feel free to pass this summary onto your friends, family, colleagues and other people you think we may be able to assist.

Quarterly Review July 2013

Market Review

The final quarter of the 2012/13 financial year was full of volatility. May saw our market hit highs not seen since the GFC but the market began to pull back in the middle of May and this pull back continued into June. The final result was the market dropped 163.9 points or -3.3% for the quarter.

The final result for the 2012/13 financial year has still been very positive. The ASX/200 rose 708 points to record a 12 month return of 17.29%.

The market pull back has provided good buying opportunities especially within the banking sector where prior to the pull back valuations were looking stretched. Dividend income is still particularly strong as demonstrated below:

StockGrossed Up Dividend Yield at 30/06/2013
ANZ7.60%
CBA7.46%
NAB8.81%
Westpac8.41%

This quarter the RBA provided us with a 0.25% interest rate cut with the official cash rate now sitting at 2.75%. We are expecting another interest rate cut over the coming months however the falling Australian dollar may delay this cut. It should be noted that interest rates are at 40 year lows and mortgage holders need to consider if it time to fix rates over the coming months.

Our outlook for the Australian Share market is still positive and while we expect volatility to continue these negative periods provide the perfect time to enter the market.

Economic Update

Coming out of the first quarter of 2013 the data shows our economy is slowing down. The first quarter GDP statistics were weaker than expected with the economy growing around 2.5%, which is below the 3% trend rate of growth.

Consumer confidence fell 7% in May, which was the biggest monthly decline since December 2011. This can probably largely be attributed to the Federal budget.

Job vacancies fell 2.4% in May after falling 1.7% in April to what the ANZ described as “the lowest level so far in this cycle”. Household surveys also showed more people are concerned about losing their jobs. This will also put pressure on GDP as higher unemployment, low consumer confidence and tighter household expenditure will likely further restrict growth.

The future of Australia’s interest rates and also the sharemarket will be highly dependent upon our unemployment rate. The unemployment rate was 5.50% in May and has increased by 0.20% over the last 6 months. The future unemployment rate will reflect the level of economic strength or recovery in the months to come.

Notwithstanding the softer data, the Reserve Bank of Australia (RBA) decided to leave interest rates alone (currently 2.75%) at its meetings in early June and July. In a statement released after the meeting, the RBA noted the slower pace of growth and that inflation remains under control, while the effects of past interest rate cuts are showing up in household behaviour. The lower Australian dollar was mentioned as a factor contributing to easier financial conditions which did not justify an immediate rate cut. However, the Bank noted scope for further rate cuts in future if necessary to which we expect another before December 2013.

What’s Causing the Current Market Volatility?

Amongst the many factors that are driving the volatility in the Australian market at present, four big ones spring to mind.

First, there are global forces which are driven by nervousness surrounding the “tapering” of quantitative easing in the US.

On the 19th June, US Federal Reserve chairman Ben Bernanke indicated that “tapering” – slowing the pace of the Fed’s asset purchases – could begin later in the year if growth, inflation and the labour market meet expectations. Markets reacted negatively to this statement.

Second, there are concerns around Chinese growth being disappointingly slow and unease around a credit squeeze.

Mid June saw the unofficial manufacturing PMI for June fall to a worse than expected 48.3 which represented a 9 month low and signalled contraction within China’s economy.

A sharp spike in interbank rates in China raised concerns over the stability of China’s banking system, culminating in a near-panic on the 25th June when the Shanghai Composite index fell 6% intraday before rallying 6% later in the day after the People’s Bank of China said it had injected funds into some financial institutions to bolster their liquidity.

Third, there are domestic factors at play, with the resource sector outlook under threat following commodity price falls and profit downgrades.

Commodity prices have been generally lower dragged down by both the “QE Tapering” & “China” fears. Gold has been the biggest casualty falling 13% over the month of June.

Most companies within this sector are delaying or cancelling projects and undertaking cost cutting measures.

And fourth, the sharp fall of the Australian dollar is prompting overseas investors to repatriate their funds, and in order to do so, they are rushing to sell Australian assets.

While this is a negative for anyone planning an overseas holiday there is a general belief that a lower currency is not only good for an economy’s competitiveness but also its stock market. This has been demonstrated in Japan with the Nikkei booming since its currency headed South.

A lower Australian dollar will make Rio & BHP Billiton more profitable companies, as their exports, albeit with lower commodity prices get converted to Australian Dollars.

How Fund Managers for the Big 4 Banks Short Change You

This article appeared in the Sydney Morning Herald on 18th December 2013, written by Michael West.

Imagine if the fund manager was BT and its only investment was a bunch of shares in Westpac, which is BT’s parent.

Or imagine it was MLC, with its only assets being shares in National Australia Bank; or Colonial only invested in Commonwealth Bank stock, or ANZ with a holding in ANZ shares and nothing more.

It might sound far fetched but this is precisely what is going on in another asset class. That asset class is cash.

An investigation by Business Day has found the big four banks are using their cash management operations as a source of cheap funding.

So their wealth management customers are being dudded, because the organisations holding their money are settling for lower returns by investing only with their parent companies, rather than seeking best return out in market.

Duty to diversify

Just as in bonds and equity funds, cash funds have a duty to diversify – in case of disaster. The fund manager also has a duty under the law to pursue the best return possible by shopping around in the bank bill and CD (certificate of deposit) markets.

Instead, the investment giants BT, ANZ Cash Management, Colonial and MLC are all funneling their clients’ money straight upstream into their parent banks.

“Westpac and St George is where the cash is held and it’s a mix of deposit and bank bills,” a spokesman for BT confirmed.

A spokeswoman for Commonwealth Bank also confirmed that cash management clients of its Colonial investment operation were invested with the parent bank.

“I can confirm this is held in cash deposits,” she said.

The numbers are enormous. Colonial’s FirstChoice investment platform is called FirstRate Saver. FirstRate Saver accounts for about 5 per cent of the overall $63 billion in funds under management on the FirstChoice platform. So the FirstRate Saver manages $3.3 billion.

Its rate is now 2.4 per cent – well shy of the 3.3 per cent rate on a four month term deposit with the Commonwealth Bank, or for that matter the 3.7 per cent rate on offer with rival UBank to park money for three months.

Although the banks are clustered around the 2.4 per cent return mark for their cash fund customers, ME Bank is touting 3.5 per cent for just one month. RaboDirect is at 3.35 per cent.

What we don’t know is whether any of the responsible entities for the big four wealth managers bothered to contemplate enhancing the returns for their customers by parking any money with ME Bank or Rabobank. It is highly unlikely.

Had they done this, however, their customers might have been considerably per cent better off.

Safe Asset

Cash is considered the safest asset class thanks to its liquidity but it is also the lowest yielding. As in property, bonds or equities, the fund manager is not only beholden to diversify but also to chase the best possible return for the client.

Sadly, this is not happening in the cash market. The wealth divisions of the big banks are merely investing in their own parents, giving the big banks a cheap source of funding at the expense of their millions of customers.

Spokespeople for MLC and ANZ’s wealth management arm also confirmed their customers’ cash was being funneled up to the parent banks.

One high net worth client of MLC subsidiary Plum Financial Services said he noticed MLC had allocated a few hundred thousand dollars of his investment to the MLC Cash Fund earlier this year owing to the volatility of the sharemarket.

“On reviewing the performance of this fund [trackable month by month on the MLC website] I was surprised to find that it was so low [year to date about 2.5 per cent net]. This is miserably low even in today’s interest rate environment, where three- to 12-month term rates are still available around the 3.5 per cent to 4 per cent mark, and my online deposit with NAB is currently paying 4 per cent. Of course, if we go back a year or so available rates were significantly higher,” he said.

“The performance rates are net of tax [maximum 15 per cent] and fees, but as far as I can see there is an unexplained gap of around 1 per cent between what I would expect the fund quite easily to have achieved, and its actual performance.”

According to the PDS: “The fund invests in a range of short-term securities issued by Australian government bodies, banks and corporate borrowers. MLC currently utilises the expertise of National Specialist Investment Management in the management of this fund. The portfolio is designed to suit an investor where a high level of capital security is paramount.”

It appears that MLC’s investment advisers are placing their clients’ superannuation in the MLC Cash Fund, which then invests exclusively with MLC’s parent company, NAB, at below market rates, for which service MLC charges 34 basis points.

There is undoubtedly a conflict of interest in the wealth managers placing funds exclusively with their parents. But it may be more than a mere lurk.

The ANZ spokesman pointed out – and this may be the case with the other banks also – that the investment with the parent bank is disclosed in the Product Disclosure Statement.

Notwithstanding any disclosures buried in the PDS, though, the responsible entity (RE) – which has the dual role of trustee and manager of an investment scheme – is required to put the interests of members (investors) ahead of the interests of the bank.

It seems clear that this is not the case. Rather than chasing 3.4 per cent yields for their members, the banks are parking it with themselves at far lower rates, rates in the vicinity of 2.4 per cent.

Section 601FD of the Corporations Act says “an officer of the responsible entity of a registered scheme must (a) act honestly; and (c) act in the best interests of the members and, if there is a conflict between the members’ interests and the interests of the responsible entity, give priority to the members’ interests . . .”

In their defence, the banks may contend that they need to have the cash available at the shortest notice for the purposes of investor security – hence the low rates.

Yet there is little sense in running a billion-dollar fund on the basis that everyone might want their cash back tomorrow. What you would do is use the incoming daily cash to pay out the daily withdrawals to save on transaction costs, and you would also make assumptions based on actuarial advice as to the varying maturities of the deposits that you make, spreading the risk of course as is required while remaining invested short-term.

Non-Bank Players

Non-bank players in the cash market, such as The Trust Company, typically shop around, diversifying their customers’ cash between the banks, chasing the best rates in their members’ interests.

That is what fund managers are paid big bucks to do, invest competitively in order to enhance returns, and diversify for purposes of safety. As the NAB customer says, they are not paid to clip the ticket for 36 basis points.

A cynic might say that, as the banks are underpinned by government these days, they don’t have to worry about safety, so why diversify? If they don’t have to worry about safety, though, that is all the more reason to pay a higher return. Unfortunately, competition has been lost in banking and wealth management due to the encroaching concentration of vertically integrated big players who control the market.

On rough numbers there is $510 billion invested in master funds in Australia. Some $19 billion is parked in cash and another $5 billion in capital guaranteed. But there is also $245 billion of the $510 billion in “mixed portfolios”. Perhaps 8 per cent of that is in cash too. These figures don’t count self-managed super.

It may be that the nation’s investors – which is most of us via a portion of superannuation – are being short-changed to the tune of hundreds of millions of dollars a year thanks to interest forgone on what might have been much better cash rates. If so, and given the competitive dynamics of the banking industry, this cash cartel is more of a racket than a lurk.

Superannuation Changes

What’s New

In conjunction with the Budget announcements, the Government confirmed some of the changes to superannuation that had been previously stated. There were no real surprises and the usual tinkering with superannuation was minimised.

We have summarised the changes below. The coalition has yet to announce whether it will support all of the changes if elected later this year. So again, watch this space.

Increase in Superannuation Guarantee Contributions

The increase to compulsory superannuation payments for workers has finally arrived. From 1 July 2013, the superannuation guarantee contribution minimum percentage becomes 9.25% – an increase of 0.25% from its current level of 9%.

The rate of SGC will continue to increase over the next 7 years to reach its desired level of 12% in 2019/2020.

Employers: you should take note and ensure that you adjust your payroll systems and account for this change.

Higher Concessional Contribution Cap

The concessional contributions cap for current financial year (2012/2013) is $25,000. From 1 July 2013, the arrangements for the concessional contribution limit will be:

  • From 1 July 2013, the concessional contribution cap will increase to $35,000 for all people aged 60 and over;
  • From 1 July 2014, the concessional contribution cap will increase to $35,000 for all people 50 and over;
  • From 1 July 2018, the concessional contribution cap is expected to increase to $35,000 for all people regardless of age.

Excess Contribution Refunds

Individuals will be allowed to withdraw all excess superannuation contributions received by their fund from 1 July 2013. In addition, excess concessional contributions will be taxed at the individual’s marginal tax rate plus an interest charge, not automatically at the highest marginal tax rate.

This proposed change is designed to ensure that excess concessional contributions are taxed in the same way as any non-concessional contributions made by the member.

Note however that a member who pays tax at the highest marginal rate may pay a higher total tax rate on excess contributions under this proposal due to the additional interest charge.

Tax on Pension Earnings Over $100,000

From 1 July 2014, investment earnings of more than $100,000 a year on superannuation pensions and annuities will no longer be tax free, but will instead attract tax at a rate of 15%. The first $100,000 in earnings per individual per year will continue to be tax free. Special arrangements will also apply for capital gains on assets purchased before 1 July 2014.

The Government has confirmed that these measures will also apply to pension benefits being paid from defined benefit funds. The previous announcement stated this would be achieved by actuarial calculations of the notional earnings each year for defined benefit members in receipt of a concessionally-taxed superannuation pension. No further detail on implementation has been given in the Budget papers. This proposal is yet to be legislated.

Account Based Pensions to be Deemed

From 1 July 2015, new account based pensions commenced will no longer be able to take advantage of the deductible amount for social security purposes, thus the entire pension amount will be deemed as a financial asset.

All superannuation pensions held before 1 January 2015 will be grandfathered indefinitely and will continue to be assessed under the existing rules for the life of the product – no current pensioner will be affected unless they choose to change products.

Our Investment Philosophy

Many of our clients that have come over from other advisers have one common complaint: we lost money from investing in failed products.

One principle that Level One has fiercely upheld in the 9 years we have been advising is that we do not invest in the types of products that have been seen to fail. This predominantly means that we do not invest in mortgages, unlisted property trusts and agribusiness products.

Here is a list of some of the products that suffered greatly or failed in the lead up and amidst the GFC. You should note that most of the products are mortgage, unlisted property trusts and agribusiness investments:

  • Trio Capital / Astarra
  • LM Investment Management
  • Opus Capital Group
  • Basis Capital
  • MFS Limited (now Wellington Capital)
  • Aspen Property Funds
  • Real Estate Capital Partners
  • Prime Property Fund
  • SAIteys McMahon / Orchard (now Arena Investment Management)
  • Australian Unity
  • Prime Retirement & Aged Care Property Trust
  • Australian Unity Property & Mortgage Funds
  • Timbercorp
  • Pilandri Wines
  • Willmott Forests
  • Great Southern
  • Banksia

These products at one time or another offered inflated returns for investors and extra-large commissions for advisers.

Level One has not and will not ever invest in the above products. We will, where possible, always refuse commissions from product providers and will never let this sway our judgement of the actual financial product on offer.

In adhering to our principles of conservative investing we believe that ‘if it seems too good to be true, it probably is’ and we don’t touch it.

Quarterly Review – January 2013

Market Review

The final quarter of 2012 calendar year was again positive for the Australian Share market. The ASX/200 rose 261.9 points or 5.97% from 1st October 2012 – 31st December 2012.

For the 2012 calendar year the ASX/200 rose 592.3 points to finish at 4,648.9 points. This delivered a total return of 14.6% for the twelve month period. This is the growth return for the Share market, dividends paid on top of this increase the return further.

On the interest rate front, The Reserve Bank of Australia cut interest rates from 4.5% at the start of 2012 to 3% at the end of 2012.

The drop in interest rates has seen more investors moving money out of term deposits and into the Australian Share market. While high yielding stocks were the most appealing acquisitions in 2012 out of favour resource stocks have had a late resurgence in December.

We see good value within the resource sector at present. BHP is currently paying a fully franked dividend of 4.01%. When compared to Term Deposit rates of 4.3% we see BHP as an attractive investment as we see upside in the share price. Albeit investors need to be prepared to accept volatility. On the flip side the banks continue to offer a high yield with a lower level of growth potential.

At this stage it looks like the looming “fiscal cliff” in the USA has been averted, however negative comments from the Federal Reserve’s minutes in relation to concerns over current bond purchasing measures and comments that the stimulus program may be withdrawn earlier than expected, have had some negative impact on share markets.

There are some positive signs coming out of America; housing markets look to have bottomed out and the unemployment rate continues to tread lower. However, the prospects for a long-term sustainable recovery will depend on policy makers implementing the required reforms to reduce debt.

We continue to expect volatility within the market but given the current valuations and income supporting Australian Shares we expect a solid return for 2013.

Economic Update

2013 has a few obstacles lined up for our economy: further declining terms of trade, the winding down of the mining investment boom, the stubbornly strong Australian dollar, and substantial fiscal tightening by both state and federal Governments (it is an election year after all). There are a few positives to soften the blow expected however, with these being the influence of monetary easing by the RBA so far (and possibly more to come) and the potential for mining exports to lift as new capacity comes online and China makes a modest recovery.

Real GDP has slowed further coming out of the last quarter of 2012 and, although economists predicted growth to be around 3%, this has been downgraded to a more realistic figure of 2% – 2.5% in 2013. This is largely due to the belief that the impending obstacles having a more significant impact on our economy than first expected.

Terms of trade have fallen 14% over the last year and are likely to decline further.

Previously, increasing incomes fuelled by the commodity boom were being supported by the increase in prices; however this is now being reversed and is shown by declining nominal GDP – an increase of only 1.9% in 2012 to September after growth of 8.1% in 2010 and 6.6% in 2011.

The Australian Government is unlikely to achieve its desired fiscal surplus this year but nonetheless is implementing the largest fiscal tightening since at least 1970.

Interest rates are expected to decline further – we believe down to an all-time low of 2.5%. However, households in deleveraging mode will more than likely save these rate cuts instead of spending them which is another adverse economic effect, especially for the non-mining sector. Thus this rate reduction strategy has not had the desired effect of previous attempts, but time will tell if things can be turned around as consumer confidence grows.

While massive cash and fixed interest holdings are being held by super funds, corporate Australia and “mum and dad” investors, the reduction in interest rates have already seen some long term conservative investors moving their monies into the sharemarket – seeking out the high yielding stocks such as the big four banks and Telstra. Further reductions could see more money move into shares and push the market higher over the next year or so.

The Australian dollar is still high despite falling commodity prices, the China slowdown, risk aversion around Europe and RBA rate cuts. The AUD has remained stubbornly resilient, predominantly due to global investors seeing it as a safe haven and the stability within the resources sector as mining and infrastructure spending is largely locked in. Currency models suggest that the AUD should lower to parity with the USD, however if global investor sentiment becomes aggressive this could fall towards USD0.90 in 2013.

In summary, the implications for financial markets seem to be: more RBA easing, subdued long-term interest rates, a weaker Australian dollar, and moderately higher share prices.

Spotlight on BHP & Rio Tinto

2012 was a tough year for BHP and Rio however a strong pick-up in December saw these stocks move out of the red and into positive territory.

BHP started the year at $34.42 and finished the year at $37.10, an increase of 7.79%. During the twelve month period BHP dropped to a low of $30.09 on 12th July 2012. It’s worth noting that BHP’s share price at 30th November was $34.39 so the capital increase for the twelve month period was all made in the month of December.

Similarly Rio Tinto started the year at $60.30 and finished the year at $66.01 an increase of 9.70%. During the twelve month period Rio dropped to a low of $48.37 on 30th August 2012. Rio’s share price at 30th November was $58.75 which was below the 2012 initial price. Again the capital increase for the twelve month period (as well as the regain of losses for the period) all occurred in the month of December.

On 12th December 2012 UBS reiterated their “Buy” rating for both BHP & Rio. They also updated their twelve month price targets: BHP $40 and Rio Tinto $86. If we see these prices achieved the growth return will be 7.82% for BHP and 30.28% for Rio when compared to the 31st December prices. Please note that dividend income is on top of these figures.

The outlook for commodity prices for 2013 is flat, thus BHP and Rio will need to reduce costs to drive earnings growth. The implementation of this strategy commenced last year with Rio announcing cost cuts of $5 billion of which UBS expects $3.3 billion to be sustainable in the long term.

2012 was the year for High Yielding Stocks such as the Banks and Telstra. What will be the top performer for 2013?

Australian Wheat: Next Chinese Boom

This is an article that was published in the Australian Financial Review on 14 August 2013, written by Angus Grigg and Lisa Murray.

China, long a minor buyer of Australian agricultural commodities, may be about to emerge as the biggest customer of Australian wheat farmers.

Domestic producers have already forward sold more than 2 million tonnes of wheat to China before the shipping season begins in October, according to Brett Cooper, the senior markets manager at commodities trader FCStone.

“It’s very possible we could sell them more than 4 million tonnes next ­season,” he said.

With sales of other farm products to China booming as well, China could surpass Indonesia as the biggest buyer of Australian wheat within a year, ­analysts believe, a change which would add an important new dimension to a trade relationship that is now dominated by coal and iron ore.

A severe drought in China’s south, floods in the north and rising demand from the middle class have triggered a sharp jump in demand for wheat to make bread, pastry and other foods.

On Monday night the United States Department of Agriculture upgraded its ­forecast of Chinese wheat imports to 9.5 million tonnes in 2013-14, almost ­triple the previous financial year.

On average China has imported 1 million tonnes of Australian wheat annually over the last five years.

“As soon as they [the Chinese] step into the market they can really push things around,” said a senior commodities analyst at Australian Crop Fore­casters, Nicholas Brooks.

Other farm products are in demand too. Chinese buyers drove Australian sorghum prices to a record high this year as traders scrambled to secure supplies to make the popular white spirit known as baijiu. In April the ­canola price spiked more than 20 per cent after China lifted an import ban on Australian oilseeds.

Sheep exports up

Sheep meat imports from Australia were also up 135 per cent in the first half from a year ago, while beef and veal imports have surged 20-fold over the same period, partly due to a crackdown on smuggling.

At the start of the year, the beef industry predicted total exports for the year of 35,000 tonnes. Those expectations have now more than tripled.

The chief executive of ANZ Banking Group, Mike Smith, recently said that people “just don’t get” the rapidly evolving soft commodities story in China.

“Demand for protein is just growing exponentially in this part of the world,” he said on a visit to the western Chinese city of Chengdu.

“Countries like Australia and New Zealand are at an extraordinary advantage because the logistics costs are so much less than anywhere else,” he said.

The USDA will release a more comprehensive “Wheat Outlook” this week. It said last month that Chinese government reserves of milling quality wheat, which are used to keep the market ­stable, have fallen and it expects imports to surge as China rebuilds those reserves. “Every uptick in expectations for China’s imports is going to lead to some interest in the Australian market,” said Graydon Chong, a senior analyst at Rabobank.

Strong outlook for wheat

Rabobank forecasts Australia’s wheat crop will reach 24.2 million tonnes this season, up 2 million from a year earlier. Over the last two years China’s annual wheat consumption is estimated to have increased by 18 million tonnes to 125.2 million tonnes.

The chief analyst at Profarmer ­Australia, Nathan Cattle, said Chinese demand would be especially important for Australian farmers next season.

“Australian wheat is struggling to compete on price into the Middle East and North African markets as supply is increasing from the Black Sea area,” he said. “So the Chinese buying is a very significant development.”

Argus & Teele – Two Grumpy Old Men: How We Messed Up The Boom

This was an article written by Richard Gluyas in The Australian on 17th August 2013.

IN a well-appointed Collins Street office in Melbourne, Bruce Teele pauses for a moment of self-reflection and turns to his long-time colleague and former BHP Billiton chairman Don Argus. “Don, we’re sounding like a couple of grumpy old men,” he jokes.

The two 75-year-olds with a combined 61 years of experience, soon to step down from the board of our largest listed investor, Australian Foundation Investment Co, have been debating the ills of Australia Inc — and there’s a lot to be concerned about.

There’s the wilful destruction of corporate memory, the “scandalous” lack of capital discipline surrounding the National Broadband Network, the erosion of blue-chip listings on the Australian Securities Exchange, the unwanted introduction of sovereign risk and a desperate plea to resolve an emerging budget crisis by lifting the GST.

But when it comes to the resources boom, that once-in-a-lifetime windfall that has now passed its lucrative peak, Teele casts aside any vestige of caution.

“The goose is dead, or it’s lost a leg at the very least,” he tells The Weekend Australian.

“I’ve been in the market for over 50 years and this has been the greatest failure of infrastructure, planning, regulation, whole masses of things.

“A lot of this is just a replica of the Japan-driven boom, but it’s a whole lot bigger, and my theory is the corporate and advisory memories have gone — the practical and experiential memories.”

So, what does the nation have to show for the swollen $200 billion river of cash that flowed into government coffers across the past decade or so?

“Egg,” says Teele.

Egg? “Yes, egg. Egg on our international face.” It was 47 years ago that Teele joined the board of AFIC, which was a satellite of the establishment JB Were & Son stockbroking franchise. He became chairman in 1984 while serving as Were’s chairman and chief executive from 1978 to 1997.

Argus, by comparison, is an AFIC novice, joining the board in 1999.

The bond between the two men is so strong it’s like a mutual admiration society.

Argus, chief executive of National Australia Bank from 1990 to 1999, has described Teele as a local version of legendary US investor Warren Buffett.

He credits him with helping to launch NAB’s golden age of prosperity in the 1990s by convincing the bank to launch what was then the biggest rights issue in Australian corporate history: a one-for-five offer at $5.25 a share to raise $1.055 billion.

NAB, as result, emerged as a powerhouse from the early 90s recession, only to squander its position as the nation’s most valuable bank in 2004.

Teele says of Argus: “He ran the bank at a very interesting time and was able to make some very bold moves, and the bank was always properly capitalised and secure.”

Argus says simply: “Yes, we knew our risks.”

It’s a theme to which the former NAB chief returns, but in a global context.

When Teele describes the financial crisis as “scary”, even against AFIC’s long history dating back to 1928, Argus sheets home blame to banks that were blind to their balance sheet structures and the need to preserve liquidity.

The risks, he cautions, are still out there.

“I don’t think the banks around the world trust each other, and that’s evident in the inter-bank borrowing rates,” he says.

“People are wary about who’s going to be there when you need them.”

Teele chimes in: “You need to watch that one every day. The inter-bank rates are telling you something that you don’t read in the headlines.”

Argus says the core problem in Europe is that banks have been “stuffing their balance sheets” with bonds issued by technically bankrupt countries, when their true function was to be “a messenger” in the economy.

He says economic stimulus and “washing false money through the system is, to me, very short-term”.

Teele’s view is that the financial system has “become used to steroids, or other opiates”, a practice it must abandon sooner or later.

It’s an issue, he says, that AFIC considers in its long-term investment decisions.

While Europe and the US is the focus of much discussion on system-threatening debt levels, the AFIC duo consider that our currently stable AAA credit rating offers false comfort.

“We’re comparing ourselves to bankrupt economies, for goodness sake!” Argus protests, saying New Zealand’s slide from AAA status is a warning for countries such as Australia that continue to rack up cash deficits.

“If you add in the consumer debt, Australia is carrying one of the world’s biggest debt loads; we’re up to pussy’s bow in it and everyone thinks it’s someone else’s problem.

“All this stuff about ‘Don’t worry, everything’s all right’ is just nonsense.”

The nation’s fiscal challenge is magnified, he says, by 45 per cent of its revenue base coming from the debt-laden consumer.

Both men believe the tax take from corporates is also under long-term pressure, with the number of companies in AFIC’s porfolio dwindling from 200-300 when Teele joined the board to its present level of less than 100.

He blames a lack of competitiveness due to high costs and eroding productivity, with large corporates increasingly seeking a superior return from investing offshore.

Argus laments that if there were 200 companies creating significant value in Australia, then the nation would not have a problem with its cashflow budget.

“But if you spend more than you earn and you haven’t got enough companies paying tax, then you’d better do something about it pretty quickly,” he says.

Talk of high costs and lack of fiscal discipline, of course, brings us to the National Broadbank Network.

Argus says the NBN is “scandalous”, while Teele says it has defied “normal commercial processes” with its lack of proper costing or cost-benefit analysis.

“If a company did that they’d be dog meat. They’d be out. And so they should,” he says.

Interestingly, Argus is prepared to shoulder some of the blame for the same lack of capital discipline shown by the resources industry at the height of the boom.

When Teele says the industry’s returns profile would have been better had it paid more attention to its dividend-paying responsibilities rather than “chasing production”, Argus, the former BHP Billiton chairman, agrees.

“The truth is that resources wasn’t front and centre for BHP until it demerged the steel business, so we had to play a catch-up game because we hadn’t invested in iron ore for three to four years,” he says.

“But we could have prioritised the returns differently in favour of the shareholders, which would have meant the capital expenditure would have been a bit slower.

“That’s one of the things you reflect on when you look back.”

It’s a significant concession, with Teele softening the blow by volunteering — somewhat tongue-in-cheek — that his views are “very, very old-fashioned”.

As to the future, Argus questions the source of all the recent talk that the boom is over.

He argues that Chinese-driven demand for our commodities is not going to go away, although prices could fall because of increased supply.

One thing is certain, though, and that is the federal Treasury will never be able to predict the revenue flow from the resources sector.

“I’ll say this and you can quote me,” Argus says. “Treasury has never been able to model the price curves of commodities; they’re always over-extending the revenue that we’re going to get from the resources industry.”

On a more positive note, Teele and Argus reserve praise for the local banking industry, and are not at all surprised that the four big banks in a lightly populated country are inside the global top 20 by market value.

Argus recalls the dark days of the early 90s, when Westpac and ANZ were teetering and “should have fallen over”.

He agrees with Teele that the heightened audit and regulatory supervision of the sector left it well-placed to withstand the GFC.

“The banks get belted unmercifully and I’ve criticised them for being giant building societies and not concentrating on business lending,” Argus says. “But we saw after 1989 that when two of the majors had their heads down and were trying to dig themselves out of the mire, that the nation didn’t grow as quickly as it could.

“The only thing is that the growth isn’t going to be there with the level of consumer debt.”

And for all their criticisms, the two AFIC directors, who will step down at the annual meeting in October, firmly believe a turnaround is achievable.

“Populism won’t do it but it might get you into office,” Teele says. “And the danger is that governments are leaving such a legacy at state and federal level that the incumbent almost has an impossible task. But it can be done because it’s been done before.”

Argus says the country has to encourage investment by controlling “spiralling” input costs.

“It’s as simple as that,” he says.

Australian Taxation Office Update

Scam Emails & Phone Calls

We again warn you about the scammers targeting individuals, companies, self-managed super funds and trusts. The latest reported scams are email phishing and phone calls, stating that the sender or caller are a representative of the ATO, and request personal information from you.

Emails sent to you are most often official looking and make claims such as tax refunds are payable by completing an online form. These emails may not be captured by your junk and spam filters, adding to the pretence that they are legitimate.

IMPORTANT NOTE: THE ATO WILL NEVER PROCESS TAX REFUNDS VIA AN ONLINE FORM EMAILED TO YOU AND THEY WILL NEVER EMAIL YOU AND ASK YOU FOR YOUR PERSONAL DETAILS.

If you do receive an email from the “ATO” please delete it immediately, do not open any attachments or provide any details, or call us for assistance.

The scammers may also make phone calls to you, claiming to be a representative of the ATO. They will state that they are calling about you, your company, super fund or trust. These details are available from the public registers such as ASIC or the Australian Business Register; hence they will likely sound confident. They will then ask you for your Tax File Number (TFN) or the TFN or Australian Business Number (ABN) for your company/trust/super fund.

IMPORTANT NOTE: THE ATO WILL NEVER CALL YOU AND ASK FOR YOUR TFN OR ABN.

If you are contacted by phone and are asked these questions, simply state that if they were actually a representative of the ATO they would not need to ask this information and to contact your accountant. Again, they would have details of your accountant. Under no circumstances should you give them your personal details, including your TFN and/or ABN.

Details that you provided to these scammers are used to steal your identity, fraudulently obtain loans and bank accounts in your name, or, if attachments to emails are opened or you have clicked on a link, the scammers can infect your computers with ‘malware’ or malicious software which can monitor your web browsing and steal your personal information.

Bottom line, the scammers are savvy and have become increasingly sophisticated. If it doesn’t feel right, look right or you are unsure, leave it alone and contact us for assistance.

ATO Enforcement

Over the last six months, the ATO’s attitude to non-lodgement or late lodgement of tax returns, Business Activity Statements and other tax compliance documentation has shifted from somewhat lenient to extremely strict. Their enforcement of fines, penalties and interest charges has tightened and their willingness to waive these has significantly decreased.

These tougher regimes have no doubt been brought about from the Federal Government’s budget position.

In light of this we need to work together to ensure that your tax compliance deadlines are adhered to and that we have received the necessary documentation from you well in advance of the due dates to see that your compliance requirements are met.

Market Wrap Up August 2013

Market News

The Australian Share Market finished in the black again in August, with the S&P/ASX200 benchmark index finishing the month 1.64% higher. This brings gains for the two month period of the 2013/14 financial year up to 6.84% which is very positive.

Consumer Discretionary was the strongest performing sector for August, up 5.5%. The Energy sector was a close second posting gains of 5.4% for the month. REITS (listed property) was the poor performer for August finishing the month down 0.2%.

Interestingly the Australian Share All Ords Index outperformed the Dow Jones index by 6.23% for August. This outperformance of the All Ords over the Dow Jones is the largest we have seen for 4 ½ years (February 2009).

Reporting season has now wrapped up with companies continuing to be cautious in their forecasts for the economy and providing limited detail in their outlook statements. The reporting season confirmed a sluggish backdrop for corporate earnings, with a key focus on costs and efficiency.

Over the reporting period, BHP Billiton reported underlying earnings of US$11,798m, which is down -31% from the previous year. On the other hand CBA reported a net profit after tax (NPAT) of $7,677 million, which represents an 8% increase on the prior year. Woolworths also reported a NPAT of $2,259.4 million, up 24.4%.

The big issues that are affecting the market at the moment are:

  • Syria
  • Impact and timing of tapering in the USA (when the Fed starts tapering back its bond buying program)

We expect the market to be volatile over September and October however the combined effects of lower interest rates, lower Australian Dollar, the election out of the way and an improving global economy and a positive stock market will make for a better than expected Aussie economy in 2014.

Interest Rates

Interest rates were again left on hold this month with further cutting expected later in the calendar year. Please see below consensus predictions on interest rates over the coming quarters:

SMSF Seminar Invitation

Level One cordially invites you to our complimentary upcoming seminar event—SMSFs: Take Control of Your Super.

This seminar is designed for anyone who doesn’t currently have a Self-Managed Superannuation Fund and would like to find out more about the benefits of self-managed super. Existing SMSF trustees will also find the content valuable.

By attending our SMSF education seminar, you’ll learn:

  • Why more than one third of Australia’s superannuation monies are invested in SMSFs
  • The basics of SMSFs and how they operate;
  • Whether an SMSF can benefit you;
  • The basics of investing in an SMSF;
  • Some superannuation strategies to consider;
  • How business owners can purchase their premises via a SMSF and lease it from themselves.

Doug Tarrant, principal of Level One, has been advising his clients on establishing, investing in and operating a SMSF for over 20 years. SMSFs are Doug’s passion and he keeps a keen eye on the ever-changing regulatory environment. This ongoing comprehension together with his strategic knowledge sees each and every client receive tailored advice for their individual needs.

This event is not to be missed and promises to be an informative and educational evening.

Venue: Novotel Northbeach, Wollongong

Date: Tuesday 29th October 2013

Time: 6:30 pm to 8:00 pm

RSVP: By Friday 25th October 2013

Contact: Danae Lacey or Joanne Douglas on 4227 6744

You are welcome to bring along any family, friends and colleagues you feel may benefit from and enjoy this evening. Please ensure you RSVP for any additional people as places are limited.

We look forward to seeing you.

Proposed Changes to Superannuation

Following weeks of speculation the Government has released an announcement in relation to Superannuation. We note that these changes will apply to all superannuation funds, not just Self Managed Superannuation Funds (SMSF). Please find below a summary of the announced reforms:

The Good………

  • From 1 July 2013 the Concessional Contribution Cap will be increased to $35,000 (up from $25,000) for people over age 60. This change will also apply to persons aged 50 and over from 1 July 2014. This is regardless to the size of your superannuation balance (previously reported to be under $500,000).
  • From 1 July 2013 excess concessional contributions can be returned to the member from their superannuation fund and taxed at the individual’s marginal rates, instead of taxed at the current excess concessional contribution tax rate (15% contributions + 31.5% excess contribution tax).
  • Tax free withdrawals from Superannuation from age 60 remain unchanged.

The Bad………

  • Still no changes to the treatment of excess non-concessional contributions, which are currently taxed at 46.5%.
  • Changes to how Centrelink assess superannuation pension income will apply from 1 January 2015, this will apply to new pensions only. Normal Centrelink deeming rates will apply and will probably result in reduced age pension entitlements as the “exempt income amount” is abolished.
  • The tax free status of pension income (capital gains and investment income) will be capped at $100,000 per annum per person from 1 July 2014. Income and capital gains above this amount will be taxed at 15% within the fund.
  • Capital Gains tax will apply to assets in pension phase if purchased after 1 July 2014. A breakup of how this will apply is as follows:
    • For assets purchased before 5th April 2013, the reform will only apply to capital gains that accrue after 1 July 2024;
    • For assets purchased from 5th April 2013 to 30 June 2014, individuals will have the choice of applying the reform to the entire capital gain, or only that part that accrues after 1 July 2014;
    • For assets purchased from 1 July 2014, the reform will apply for the entire capital gain.
  • At this stage its unclear if the entire capital gain will be assessed and counted under the $100,000 pension exemption limit or if capital gains tax discounting applies.

The Ugly………

The Government has stated that the $100,000 threshold limit will only affect the wealthy. Unfortunately this is not the case.

  • If you make a one off capital gain on say the sale of a property in excess of $100,000 you will be liable for this tax. This is a very likely issue especially if the property is held long term.
  • This could also occur where you are reaching retirement and want to move out of growth assets and into say term deposits or wish to restructure your portfolio as the market has performed strongly. If you generate capital gains in excess of $100,000 you will be liable for the additional tax.
  • And finally as we are all aware investment returns can be quite volatile. After a period of negative returns, positive returns of 20% are not out of the question. So if you have a superannuation balance of $500,000 a 20% return brings you up to the $100,000 mark. You will only reach the $100,000 mark if you sell your assets, paper returns are not assessed but income and capital gains are.

REMEMBER: these are proposed changes. These announcements will still need to proceed through the normal political process before they become law. More to follow as clarification becomes available.

Quarterly Update April 2013

Market Review

The first quarter of 2013 was again positive for the Australian Share market. The ASX/200 rose 317.55 points or 6.83% from 1st January 2013 – 28th March 2013. The ASX200 climbed through the 5,000 point level in February before finishing the quarter down slightly at 4,966.50 points on 28th March 2013. We note this is the first time the market has reached the 5,000 point level since February 2008.

January and February were particularly strong while March proved to be volatile with the ASX/200 hitting 5,146.90 points on 11th March before finishing the month down 137.58 points or negative 2.7%. This was the first negative performance in a month since May 2012.

We note that the Australian Share market is still trading 27.74% below the market high from 1st November 2007 (6,873.20). Interestingly the US’s Dow Jones closed above 14,000 points on 1st February 2013, which is the first time the Dow had been so high since October 2007. The Dow continued to climb, surpassing its prior all time record of 14,164.53 (from 9th October 2007) to close at 14,662.01 on April 2nd, 2013.

We note that UBS have revised their year-end ASX200 price target from 5,000 points to 5,250 points. This is on the back of low real interest rates and continued improvements within the US.

The continued uncertainty around the EU bailout of Cyprus has kept markets subdued during the past few weeks. This re-emergence of the European Sovereign debt issues highlights that resolving these debt problems will take a long time.

On the interest rate front, The Reserve Bank of Australia again left interest rates unchanged over the quarter with the last interest rate cut occurring in December 2012. We expect that interest rates may be cut again sometime over the coming months but we maintain we are very close to the bottom of the cycle. Borrowers should consider locking in either all or part of their mortgage now or over the next few months.

The interest rate on term deposits has now dropped to the low 4% range. With inflation currently sitting at 2.2% the real return from Term Deposits is currently only around 2%. These low rates are seeing more money move out of the safe haven of cash and term deposits and back into the share market where grossed-up dividend rates on the banking stocks are still around 7% – 8%.

We continue to expect volatility within the market but given the current valuations and income supporting Australian Shares we expect further gains throughout 2013.

Economic Update

The last quarter saw reports continuing to indicate that the Australian economy is slowing further.

The Reserve Bank of Australia’s latest announcements show that it expects our economy to be weaker than last year. The RBA has also noted that, although it has left interest rates on hold at 3% at both the February and March meetings, the still high Australian dollar and low inflation may still see more cuts made if the economy continues to slow. The consensus vote amongst economists is that the RBA will cut rates again at least once this year.

Commentary was also made by the RBA about the stubbornly high Australian dollar, suggesting that they are less worried about the currency and are not taking any action here to weaken the $A; neither directly via the currency market nor indirectly through interest rates.

We have seen a slip back against the $US in the recent weeks, however it is believed that the $A will remain high for the coming months. When better economic data comes out of China, we may see a shift in the $A then when it can be valued more accurately.

The RBA downgraded its near-term growth and inflation forecasts and now expects GDP growth of 2.5% as at June 2013 (was 2.75%). Underlying inflation for the same timeframe is now forecast at 2.5% (was 2.75%). By the end of 2013, growth is now forecast in a 2% to 3% range (was 2.25% to 3.25%) while inflation is forecast within the 2% to 3% target range until mid-2015.

Building approvals and retail sales were disappointing and the unemployment rate is expected to rise in 2013 from its current rate of 5.4% (despite February announced jobs figures).

Private capital expenditure (capex) data was released for Q4 2012, with a fall of 1.2% for the quarter. Of greater importance was the first intentions survey for 2013/14. Currently A$168 billion of capex is expected in 2012/13, compared to $A155 billion in 2011/12. A total of $A152 billion is anticipated in 2013/14. While the peak in mining investment is expected this year, this survey suggests the drop off in expenditure will be gradual rather than sudden. See chart below of capex intentions.

Exchange Traded Funds – ETFs

An exchange-traded fund (ETF) is an investment fund traded on a stock exchange, similar to shares. ETF’s are also like managed funds as they are pooled investments in which investors buy units. An ETF holds assets such as stocks, commodities, listed property trusts, or bonds, and trades close to its net asset value over the course of the trading day.

Most ETFs track an index, such as a stock index or bond index. ETFs may be attractive as investments because of their low costs, tax efficiency, and stock-like features. They also pay regular dividends similar to most stocks.

An example of an ETF could be an ETF that tracks the top 20 ASX shares, a Listed Property ETF or a Global Healthcare Sector ETF.

An ETF could be a suitable investment for a smaller investor looking to enter the market where they will not be able to obtain the level of diversification given the size of their investment funds. ETF’s allow you to gain exposure to many different sectors and diversified asset allocations for only a small investment. Additionally ETF’s are highly liquid as they are traded on the ASX.

ETF’s can also be utilised for specific sector tilting such as resources, banking or healthcare. With one acquisition you could potentially gain access to the top 60 or so resource stocks.

Negative characteristics of an ETF include that they are tracking the index. If the value of say CBA goes up, they buy more to keep their holding in-line with the index. Similarly if say BHP goes down they may need to reduce their holding to stay in-line with the index.

Tax efficiency can also be a problem with ETF’s and where possible it is preferable to actually hold direct shares as opposed to an ETF. An ETF must payout all income received which means dividend payments can be quite volatile.

Additionally the buy / sell price often has a gap brought about by inefficiencies within the market and at times when trading is thin. This affects your buy in and sale price which can significantly alter your returns.

Market Wrap Up July 2013

Market News

The Australian Share Market rebounded strongly in July, with the S&P/ASX200 benchmark index finishing the month 5.2% higher, its best monthly gain since October 2011.

The Materials sector was the strongest performing sector for July, up 9.3%. Within this sector BHP increased 10.4% and Rio Tinto gained 9.8% over the month of July. These are pleasing returns following the downward spiral in their respective share prices over May and June.

The Financials sector also performed well, up 6.3% in July. Specifically ANZ gained 6.97%, CBA gained 7.27%, NAB gained 7.8% and Westpac gained 6.96% over the month of July.

We expect investors to continue investing in the big four banks for their fully franked dividend yields which is currently around double that of Term Deposits rates on offer. At 31st July 2013 the fully franked dividend yield for the “Big 4” was as follows:

ANZ 7.30%

CBA 6.94%

NAB 8.37%

Westpac 7.86%

Interest Rates

The Reserve Bank of Australia (RBA) has slashed interest rates to a record low of 2.5% at its August board meeting yesterday. The cut is the first since the RBA announced a 0.25% cut in May when the Australian dollar was above parity with the greenback.

It is also only the second time the rate has been cut during an election campaign.

RBA governor Glenn Stevens announced the cut, explaining: “In Australia, the economy has been growing a bit below trend over the past year. This is expected to continue in the near term as the economy adjusts to lower levels of mining investment.

“The unemployment rate has edged higher. Recent data confirm that inflation has been consistent with the medium-term target. With growth in labour costs moderating, this is expected to remain the case over the next one to two years, even with the effects of the recent depreciation of the exchange rate.”

National Australia Bank Ltd is still expecting an additional rate cut later in the year, likely in November, “although it could be earlier”. According to NAB “This is in line with our forecasts and suggests that, having recognised the reality of lower growth with benign inflation, more rate cuts are likely.” NAB also referred to ongoing sources of weak domestic demand and a downturn in mining investment.

Macquarie Bank believes that interest rates will be cut further towards the 2% mark by the end of the year. UBS believes the RBA still has work to do but does not expect rate cuts just before or just after the September 7thelection which rules out rate cuts in September and October. They expect the cuts to occur later in 2013 or early 2014.

Insurance Levy to Hit Banks

The Rudd Government announced last week it plans to impose an insurance levy on all bank deposits. The government plans to impose a 0.05% insurance levy on every deposit of up to $250,000 to protect depositors against collapses.

The banks said they will pass on the impost, which equates to 5¢ for each $100, to customers through reduced interest payments on deposits.

This measure will put more pressure on Term Deposit rates. With rates now only marginally above inflation figures (2.5% – 3%) investors will be forced to look to other alternatives such as the share market for a higher rate of return albeit with a higher level of risk.

China’s Property Prices Soar

Despite China’s economy cooling and Premier Li Keqiang’s plight to rein in speculative investment China’s house prices have increased in all but 1 of the cities tracked by the government over the past year.

The biggest increase being 16% was seen in the southern business city. Beijing prices climbed 13% and Shanghai saw an increase of 12% for the year. All the gains have occurred since the Government changed its data methodology in January 2011.

The changes previously implemented by the Government delivered many measures targeting supply, causing prices to inflate. In March, a three-year campaign was ramped up to cool home prices, with only Beijing issuing the toughest measures which included raising the minimum down payment on second homes from 60% and enforcing a 20% capital gains tax on existing homes.

History Shows Sharemarket Investment Can Pay Off

This is an article that was published in the Australian Financial Review on 8th August 2013, written by Philip Baker.

Having the foresight, discipline and stomach to buy and hold stocks over the past two decades has been a good strategy.

Of course, everyone’s dream is to make a truckload by finding a select group of small, cheap stocks that take off, and fill the bank account without lifting a finger. But for most investors, they never get to live that dream.

Although the dotcom boom provided some opportunities and, of course, there was Fortescue Metals, which from its low to peak would have turned $5000 into just over $6.5 million. But not many can pick the bottom and sell out at the peak; fear and greed make sure of that.

Mark Hancock at Precept Investment Actuaries has done some numbers covering the past 20 years ending June 30, 2013 for the sharemarket, and including dividends – he uses the S&P/ASX 200 Accumulation index – it was up 9.6 per cent per annum.

The average price gain was about 5.2 per cent and the average dividend return was 4.1 per cent per annum.

That means a $5000 investment in the benchmark S&P/ASX 200 index 20 years ago would be worth about $14,000 today but include dividends and it swells to closer to $31,000.

According to Hancock, if franking credits are included, then it’s about $40,000.

The same amount in Commonwealth Bank would be worth $134,200, including dividends, and $41,500 without.

The numbers from Precept also show that including estimated franking credits of 1.3 per cent per annum over the past 20 years shares delivered an average annual pre-tax total return of 11 per cent.

“We estimate that . . . 50 per cent of sharemarket returns over the past 20 years have been sourced from dividends and associated franking credits, measured on a pre-tax basis,” Mr Hancock said.

He also points out that three of the worst years over the past two decades have occurred in the past six years.

That means investors missed out if they started investing in 2008 because the past five years have been tough, with an average market return of 2.9 per cent.

But don’t lose hope.

“Based on the past 20 years and even the 10 years prior to that, it would be statistically unlikely to have such another disappointing five-year period . . . from 2013 to 2018,” he said.

It’s also worth pointing out that as bad as the 2008 to 2013 period has been for investors, the five years before, 2003 to 2008, were excellent for those invested.

And again, as bad as those five years were, when they are included in the decade 2003 to 2013, shares still managed to deliver 9.4 per cent per annum, including dividends.

And that’s not bad when compared with the 9.8 per cent, including dividends, that investors got in the decade from 1993.

It would seem being patient, sucking up all those headlines during the crisis and reinvesting the dividends was worthwhile.

The market’s dive during the crisis cast a question mark over the value of buy-and-hold strategies, and term deposits were viewed by many as a much safer way to play a market beset by uncertainty.

Stock picking can be tough at the best of times but pick them and it pays. Sonic Healthcare, for example, has turned $5000 into $196,000, including dividends, over the past 20 years.

One Million in Super Won’t be Enough for Retirement

This is an article that was published in the Sydney morning Herald on 23 September 2013.

While the growth in the projected pool of superannuation savings is impressive, it belies the harsh reality facing those not far off retirement. Increasing life spans, the effect of the GFC on superannuation accounts and the fact that the superannuation guarantee started only in 1992 is leaving older workers underfunded.

And most of those retiring in the next 20 years will not have the lifestyle in retirement they are seeking. They will have to work for longer and increase contributions to their super if they are to afford a comfortable retirement.

That’s the bottom line from the latest report on superannuation by Deloitte. While the super pool is projected to rise to $7.6 trillion by 2033 from $1.6 trillion now, many are going to be disappointed with their standard of living in retirement, Deloitte Actuaries and Consultants partner Wayne Walker says.

“Many Australians approaching retirement have received super only for a limited portion of their working lives as our [super] system is still maturing,” he said.

“And, with longevity on the rise they have longer retirements to fund. Many older workers will have to work longer and contribute more to their super.”

Although younger workers would do better because they would have the benefit of the superannuation guarantee for the whole of their working lives, they would still struggle to afford a comfortable retirement. A 30-year-old worker on an average salary of $60,000 a year would have an estimated $1.1 million in superannuation at age 65 in 2048.

But, Deloitte superannuation leader Russell Mason said, $1.1 million would sustain a comfortable retirement only until age 77.

The Deloitte report, The dynamics of the Australian superannuation system, the next 20 years, 2013-2033, showed that for a comfortable retirement for the standard life expectancy, a 30-year-old male would need retirement savings in 2048 of $1.58 million and a female would need $1.76 million.

For a comfortable retirement, today’s 30-year-old needed to make additional contributions to super and salary-sacrifice 5.4 per cent of his pay, and for the woman an extra 7.5 per cent, the report said.

It also shows the retail fund sector – which includes employer-sponsored retail funds and the “personal” division of retail funds – will overtake self-managed super funds to become the largest market segment as early as 2019. The personal division of retail funds, “personal retail”, is often recommended by financial advisers to their retiree clients.

But self-managed super funds will eclipse the personal retail segment as the most popular post-retirement vehicle by 2017, the report predicts. Self-managed super funds will continue to grow to become the most popular vehicles for retirees, by far, by 2033. Industry funds will grow strongly and will hold more of accumulators’ super savings than self-managed super funds by 2023.

Bonds are Negatively Correlated to Equities?

Risk on, risk off. Equities rise and bonds fall, or bonds fall and equities rise – that is, bonds are negatively correlated to equities – and that makes bonds a great diversifier despite their low yields.

For the past few years, this idea has been absolutely correct. However, to hear some commentators, you would think that this negative correlation is a fundamental law of nature. It is not. The idea that bonds and equities are always negatively correlated is simply wrong. As the graph below clearly shows, government bonds and equities have gone through long periods where correlations are negative (since 2001) but even longer periods where correlations are positive (1963 to 2001).

Figure 1: Rolling 5-year correlations US equities and bonds (Jan 1920-Feb 2013)

In fact, there are many influences on how bonds and equities are correlated. In the 1970s, 80s and 90s, inflation was the market’s greatest fear. When inflation expectations rose, so did interest rates and, more to the point, real interest rates rose such that a 1% increase in inflationary expectations might spark a 2% increase in bond rates. Rising interest rates are not good for sharemarkets; rising real rates are a disaster, not only for equity markets but for bond markets as well.

The past six years has turned all that on its head. The greatest fear has been a deflationary collapse of the banking system. The more nervous investors got the more equity markets sold off and the more Central Banks lowered interest rates. Hence, for now, the correlation between the two assets is negative. Why correlations went negative post the Tech Wreck (early 2000’s) is harder to explain. Perhaps the Fed’s fear of a downturn was greater than its fear of inflation and, so, interest rates were kept artificially low. A spike in inflation didn’t cause a spike in real rates and equities were spared.

Going forward, it is difficult to be sure of just how the relationship will pan out. But one thing is clear – banking on a continued negative correlation to justify an investment in low returning bonds is nuts. And you can clearly see its nuts.

This is an article written by Tim Farrelly. Tim developed and operates Farrelly’s Investment Strategy.

Off-The-Plan Goes Off: Bondi Apartments

This is an article in the Australian Financial Review, published on 12 August 2013 written by Robert Harley.

In five hours on Saturday, Sydney property developer Legacy Property sold 90 off-the-plan apartments at the opening of a new tower in Bondi Junction.

Legacy’s team of 50 lawyers and agents made a sale every four minutes.

Director Matthew Hyder said the stars were aligned.

“We have had four weeks of auction clearances over 80 per cent and an interest rate cut,” he said.

But even he was surprised.

“I would have been happy with 60 sales,” he said.

Instead Legacy has only three apartments still to sell.

Australia’s housing market has been improving since a nadir in May 2012.

Since then, capital city values have improved 6.5 per cent, according to real estate analysts RP Data and Rismark.

One listed developer, the Australand Property Group, reported a solid increase in sales for new apartments and land in the six months to June.

UBS analyst Jonathan Mott said record low mortgage rates set the scene for “another bout of sustained house price inflation in Australia, and Sydney in particular”.

However, not everyone agrees.

National Australia Bank chief economist Alan Oster said consumer confidence was still the main challenge facing property.

But several off-the-plan offerings have sold at boom-time pace.

Developer Urban Inc sold all bar 28 of the 233 apartments in an inner-city project in Melbourne before its launch on Saturday.

Some of the strongest results have come from Sydney’s east. The Pacific Bondi project has achieved the nation’s highest apartment price of $21 million.

The Legacy project, Capitol, is in Oxford Street, Bondi Junction, close to Westfield and the train station, with has views of the harbour.

Mr Hyder said it “ticks the boxes” for local investors who, through agents CBRE, make up most of the buyers.

But it is not cheap. Studio apartments start at $575,000, equivalent to the median price of a house in Sydney.

Buyers pay, on average, $14,500 per square metre and for the best, up to $17,500 per square metre.

Mr Hyder said supply was the issue.

“Waverley Council fought us tooth and nail over this project but the public are starved of stock,” he said.

“It’s not indicative of a functioning model.”

Level One Financial Advisers Pty Ltd. AFSL 280061. The information contained on this website is general information only. You agree that your access to, and use of, this site is subject to these terms and all applicable laws, and is at your own risk. This site and its contents are provided to you on an “as is” basis, the site may contain errors, faults and inaccuracies and may not be complete and current. It does not constitute personal financial or taxation advice. When making an investment decision you need to consider whether this information is appropriate to your financial situation, objectives and needs. Liability limited by a scheme approved under Professional Standards Legislation. Disclaimer and Privacy Policy

Doug Tarrant

Doug Tarrant

Principal B Com (NSW) CA CFP SSA AEPS

About Doug

As founder of the firm Doug has over 30 years of experience advising families, businesses and professionals with commercially driven business, taxation and financial advice.

Doug’s advice covers a wide variety of areas including wealth creation, business growth strategies, taxation, superannuation, property investment and estate planning as well as asset protection.

Doug’s clients span a whole range of industries including Investors; Property and Construction; Medical; Retail and Hospitality; IT and Tourism; Engineering and Contracting.

Doug’s qualifications include:

  • Bachelor of Commerce (Accounting) UNSW
  • Fellow of the Institute of Chartered Accountants
  • Certified Financial Planner
  • Self Managed Superannuation Fund Specialist Adviser (SPAA)
  • Self Managed Superannuation Fund Auditor
  • Accredited Estate Planning Specialist
  • AFSL Licensee
  • Registered Tax Agent
Christine Lapkiw

Christine Lapkiw

Senior Associate B Com (Accounting) M Com (Finance) CA

About Christine

Christine has over 25 years of extensive experience advising clients principally on taxation and superannuation related matters and was a founder of the firm when it began in 2004.

Christine’s breadth and depth of knowledge and experience provides clients with the comfort that their affairs are in good hands.

Christine currently heads up the firm’s SMSF division and oversees a team that provide tailored solutions for clients and trustees on all aspect of superannuation including:

  • Establishment of SMSFs
  • Compliance services
  • Property acquisitions
  • Pension structuring
  • SMSF ATO administration and dispute services

Christine’s qualifications include:

  • Bachelor of Commerce (Accounting)
  • Member of the Institute of Chartered Accountants
  • Master of Commerce (Finance)
Michelle Jolliffe

Michelle Jolliffe

Associate - Business Services B Com (Accounting) CA

About Michelle

Michelle has been with the firm in excess of 13 years and is an Associate in our Business Services Division.

Michelle and her team provide taxation and business advice to a wide variety of clients. Technically strong Michelle can assist with all matters in relation to taxation covering Income and Capital Gains Tax; Land Tax; GST; Payroll Tax and FBT.

Michelle is an innovative thinker and problem solver and always brings an in-depth and informed view to the discussion when advising clients.

Michelle has considerable experience with business acquisitions and sales as well as business restructuring.

Michelle’s qualifications include:

  • Bachelor of Commerce (Accounting)
  • Member of the Institute of Chartered Accountants
Joanne Douglas

Joanne Douglas

Certified Financial Planner and Representative CFP SSA Dip FP

About Joanne

Joanne commenced with Level One in 2004 and has developed into one of our Senior Financial Advisers.

With over 20 years of experience, Joanne and her team provide advice across a wide variety of areas including: Superannuation; Retirement Planning; Centrelink; Aged Care; Portfolio Management and Estate Planning.

A real people person Joanne builds strong long term relationships with her clients by gaining an in-depth knowledge of their personal goals and aspirations while providing tailored financial solutions to meet those needs.

Joanne’s qualifications include:

  • Certified Financial Planner (CFP)
  • Self Managed Superannuation Firm Specialist Adviser
  • Diploma of Financial Planning

Disclaimer & Privacy Policy

Disclaimer

The information contained on this web site is general information only. You agree that your access to, and use of, this site is subject to these terms and all applicable laws, and is at your own risk. This site and its contents are provided to you on “as is” basis, the site may contain errors, faults and inaccuracies and may not be complete and current.

It does not constitute personal financial or taxation advice. When making an investment decision you need to consider whether this information is appropriate to your financial situation, objectives and needs.

Level One makes no representations or warranties of any kind, expressed or implied, as to the operation of this site or the information, content, materials or products included on this site, except as otherwise provided under applicable laws. Whilst all care has been taken in the preparation of information contained in this web site, no person, including Level One Taxation & Business Advisors Pty Limited, accepts responsibility for any loss suffered by any person arising from reliance on the information provided.

Privacy

Level One highly values the strong relationships we have with our clients. The collection of data at Level One is being handled with full and proper respect for the privacy of our clients. The data we collect is handled sensitively, securely and with proper regard to privacy laws. Level One does not disclose, distribute or sell the data we collect from our clients to third parties.