Share Market Update
The final quarter of the 2015 calendar year was positive with the ASX/200 closing at 5,295.90 points on 31stDecember 2015. The ASX/200 finished the previous quarter (30th September 2015) at 5,021.60, which equates to an increase of 274.3 points or 5.46%.
Overall the 2015 calendar year was negative falling from 5,411 points on 31st December 2014 to 5,295.90 at 31stDecember 2015 – a drop of 115.1 points or negative 2.13%.
Two of the major issues contributing to the volatility within equity markets are summarised below.
China
Fears of an economic slow down of growth in China has weighed heavily on global stock markets and the media seem happy to push this negativity. China is still growing, it has just slowed down a bit. Here’s a summary of the latest economic data out of China:
- Economic growth of 6.8% per annum in quarter four matched forecasts.
- Retail sales rose at a big 11.1% but missed forecasts of 11.3%.
- Industrial production was tipped to grow at 6% but came in at 5.9%.
- Urban investment rose by 10% just shy of the forecast of 10.2%.
China is rebalancing its economy to be less dependent on manufacturing like other first world economies have done. The Chinese economy continues to get bigger and mature and, as a result, economic growth rates are gradually easing toward the growth rates that are more common in major industrial nations.
Economic growth in 2015 was the slowest in 25 years, and next year it will be the slowest in 26 years. In Australia and in the US, ‘good’ economic growth rates are near 3%. In China, economic growth is set to hold near 6.5% to 7% over the coming year. Therefore China will out-perform for some time to come as it transitions to a ‘consumption’ fuelled economy.
Oil
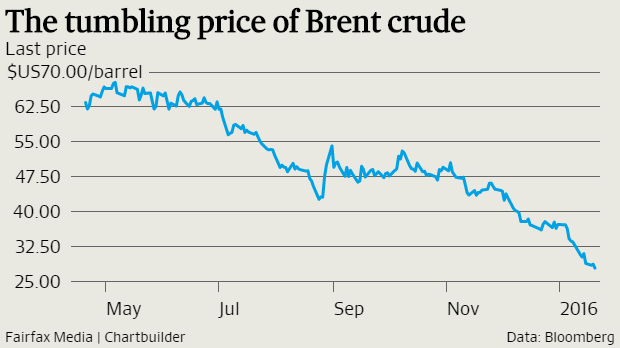
Oil has been undergoing a massive rout since mid-2014, and it just keeps going, with no floor in sight.
US crude oil is currently trading below the $US30-level for the first time in 12 years. To put that in perspective, as recently as the fourth quarter of 2014, Brent was trading at $US100 per barrel.
Since the start of the year, concern about China’s economic performance and future demand for energy appears to have weighed heavily on oil prices. But the far bigger driver of oil prices has been global oversupply. OPEC – the middle eastern cartel of oil producing countries – has faced stiff competition from US oil production, which has nearly doubled from 2008 levels due to improvements in shale “fracking” technology.
Prices began to fall in the second half of 2014, presenting OPEC with a quandary. In a meeting in November 2014, OPEC made the decision that it would try to preserve market share in the face of US competition rather than cut supply to support prices. Consequently prices have fallen sharply. To exacerbate matters, OPEC production quotas, which have been exceeded by its own members for years, have now been abandoned. And if that wasn’t enough, OPEC member Iran – which had been banned from selling oil due to US sanctions over its nuclear program – is about to re-enter the market with its own supply.
On the positive side, for a net importer of oil such as Australia the drop is considered good for the economy.While the lower oil prices affect earnings – and jobs – in the energy sector, they are also supposed to boost consumption, as they typically translate into lower fuel prices, leaving households with more money to spend. On balance, weaker oil prices “have a positive effect on overall growth of the Australian economy”, the RBA said last year.
However it isn’t all doom and gloom. If we look at the ASX Accumulation Index which also takes into account dividends, the 2015 calendar year was positive, and has in-fact been positive over the last 10 years on average as detailed below:
| 1 year | 3 year | 5 Year | 10 Year |
|---|
| Accumulation Index | 3.8% | 6.5% | 5.7% | 8.0% |
As demonstrated in the above table, stocks have paid on average 8% per annum over the last 10 year period, with about 2-3 bad years therein when the returns were negative. However, the other 7-8 positive years more than make up for the bad. The period above also takes into account the GFC, where there were serious problems compared to now. 2007 and 2008 brought negative returns but 2009 gave us a rebound in excess of 30%.
The key message here is to invest in good quality stocks with a reliable dividend and to hold your portfolio during times of volatility. We do see a lot of positive signs within our economy; however we expect volatility to continue. UBS has a 2016 year-end target of 5,500 which is a growth return of over 10%.
Economic Update
The media does a fantastic job at doom and gloom. However, when you really look at the key indicators of the Australian economy, it isn’t all that bad. In fact, it’s good. Here’s why.
Unemployment fell from 6.2% (September 2015) to 5.8% (November & December 2015).
December’s 5.8% is the lowest unemployment figure since May 2015 and saw the economy add 71,400 jobs – the largest gain since July 2000. If we see the unemployment rate fall further, or remain at 5.8% for the next few months, a new trend will emerge – one that paints a very different picture of our economy.
Business finance approvals are the best since 2009.
Businesses are borrowing money and investing in their businesses, taking advantage of the low interest rates.
Motor vehicle sales are the best ever.
The record 1,155,408 vehicles sold last year obviously mean the Australian economy wasn’t doing nearly as badly as we sometimes like to tell ourselves. Car yards don’t do increased business in hard times.
Interest rates are at historic lows with no increase in sight.
The Reserve Bank of Australia (RBA) has again kept the cash rate steady at 2% for the final quarter of 2015. It is expected to remain on hold for at least the next 12 months.
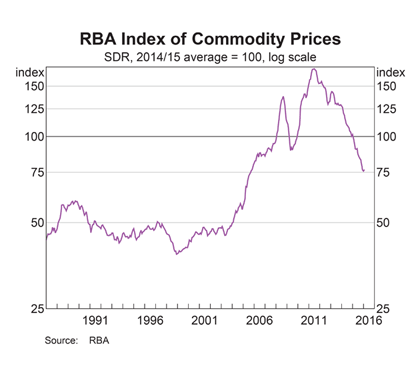
RBA Governor Glenn Stevens reiterated that the decision to keep the cash rate on hold was due to further softening of commodity prices, volatility in global markets and falling terms of trade domestically.
Oil prices are at record lows.
These low prices will act as a huge stimulus to the Australian and global economy. Look no further than Qantas’ reported bumper profits!
Residential dwellings.
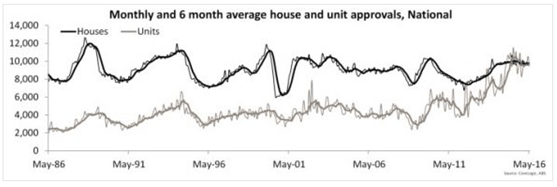
After an unexpected hiccup in the June quarter, new dwellings building rebounded in the September quarter growing by 2.1%. Residential building has been growing strongly over the last three years and has been a key driver of GDP growth. We believe we have another year of increase in new dwellings being built before the cycle runs out of puff.
Prices peaked around September 2015 but are still high. As more supply hits the market, prices will naturally taper.
Importantly, we don’t see a huge crash in residential property prices as some doomsayers predict.
Economic growth – it’s not huge but it’s still growth.
National Income (or nominal GDP, current prices) improved markedly in the September quarter, increasing 0.8%, to be up 2.2% through the year. The improved quarterly result follows the dismal 0.2% rise in the June quarter and 0.6% in each of the previous two quarters.
Nevertheless, nominal GDP growth is still tracking below real GDP growth due to weak price growth in the economy and particularly as a result of the steep falls in terms of trade. GDP is forecast to be around 2.7% throughout 2016.
Export Growth is healthy.
With a falling Australian dollar and free trade agreements with South Korea and China all locked up, and India to come shortly, export growth will become a key driver of the economy going forward.
Increased access to these massive markets will be historic in our economic development in the years ahead.
The Australian dollar.
Early this month the Australian dollar took a tumble down to its lowest point in three months. Concerns about the Chinese economy were the main driver for this devaluation as commodity prices once again fell and investors flocked to buy the currency cheaply. The dollar is trading at just under US$0.70 at present.
A lower dollar will improve the competitiveness of trade exposed industries. Tourism and education services are already benefiting. This will boost profitability and will create capacity constraints which, in turn, will encourage these sectors to refurbish and then expand their facilities.
In a nutshell.
The lower Australian dollar and the unemployment rate hold the keys to the shape of the recovery.
We have only just begun the transition from mining investment-led economy to non-mining drivers. Further, non-mining business investment will gradually build momentum. There is no magic wand that an incumbent Prime Minister can wave. The recent improvement in confidence (unfortunately just a honeymoon effect for a new PM) won’t stimulate investment until capacity tightens and profitability improves.

Property Market Update
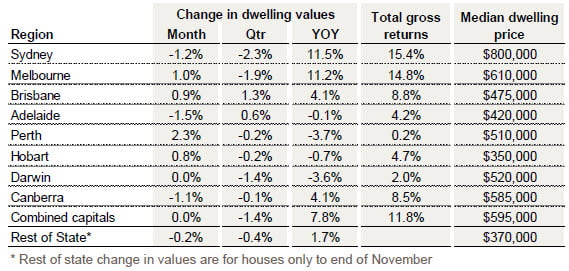
Source RP Data
Capital gains stalled in the final month of the year with Sydney recording a second month of lower home values. After showing strong conditions through to September, the final quarter of 2015 ends with capital city dwelling values declining by 1.4%.
According to the CoreLogic RP Data Home Value Index, dwelling values were absolutely flat across the combined capitals during December, with negative movements in Sydney, Adelaide and Canberra being offset by a rise in dwelling values across the remaining five capital cities. The Sydney housing market was the main drag on the December results, with dwelling values down 1.2%, while values were down 1.5% in Adelaide and 1.1% in Canberra. The remaining capitals saw a rise in dwelling values, led by a 2.3% bounce in Perth values and a 1.0% rise in Melbourne values over the month.
After dwelling values had been broadly rising since June 2012, the December quarter results revealed a 1.4% fall in dwelling values across the combined capitals, the largest quarter on quarter fall since December 2011. Six of the eight capital cities recorded a negative result over the December quarter, with weaker conditions in Sydney and Melbourne acting as the greatest drag on capital city performance, according to CoreLogic RP Data.
The largest quarterly fall was recorded in Sydney, where dwelling values were down 2.3% over the final three months of the year, followed by Melbourne, where dwelling values were 1.9% lower. The only capital cities to show a rise in dwelling values over the December quarter were Brisbane (+1.3%) and Adelaide (+0.6%).
This was in contrast to the first three quarters of 2015, where capital city dwelling values rose by 9.3%, largely driven by a 14.1% surge in Sydney values and a 13.3% increase in Melbourne. In stark contrast, the final quarter of 2015 showed Sydney as the weakest performer of any capital city, with dwelling values down by -2.3% while Melbourne recorded the second weakest result of -1.9%.
The complete 2015 calendar year results reveal a 7.8% increase in capital city dwelling values which is the lowest rate of capital gain over a calendar year since 2012 when values slipped 0.4% lower over the full year. Highlighting the diversity in the capital city housing markets, dwelling values fell across four of the eight capitals in the 2015 calendar year. The largest of these falls were recorded in Perth, down by 3.7% and Darwin down by 3.6%. Hobart and Adelaide also showed subtle falls of 0.7% and 0.1%.
Despite the recent weakening of housing market conditions in Sydney and Melbourne, the two largest capital city housing markets still recorded much stronger annual gains than all other capital cities, 11.5% in Sydney and 11.2% in Melbourne. Dwelling values in Brisbane and Canberra were up a more sustainable 4.1% over the year.
The wealth created from housing in Sydney and Melbourne has been exceptional over the past twelve months. In dollar terms, Sydney home owners have seen approximately $82,000 added to their wealth thanks to the strong capital gains over the year while home owners in Melbourne have seen the value of their dwelling grow by approximately $60,400. Brisbane home owners are $18,560 better off while Canberra owners have seen the value of their homes increase by approximately $21,900.
Home owners in the remaining capital cities have seen some erosion of their wealth via falls in the value of their dwelling. The largest losses have occurred in Perth where the average dwelling is now worth approximately $19,970 less than it was 12 months ago, while Darwin home owners have seen the value of their home shrink by a similar $18,150. The annual decline has been milder in Adelaide and Hobart, however dwelling values are still $515 lower in Adelaide over the year and down $2,430 in Hobart.
The slowdown in housing market conditions across Sydney and Melbourne in the last half of 2015 is being driven by a range of factors that can best be described as both organic and externally influenced. Organic market conditions have been derived from affordability pressures, rental yield compression and cyclical factors, while factors from external influences largely stem from a change in the regulatory framework introduced by APRA which has made it more expensive and difficult for investors to access housing finance. Added to this are higher mortgage rates and more restrictive credit policies and loan servicing requirements.
Index results as at December 31, 2015