LevelOne Logo
Header Background

Article Archive

Will I Be Covered By My Income Protection Insurance If I Lose My Job?

For families and individuals, Income Protection can be a saving grace. None of us want to imagine misfortune befalling us, yet it can – and does – happen. Hence we all need to be prepared.

The Global Financial Crisis forced us all to take a long hard look at our lives and to reassess our needs and priorities to prepare for the unthinkable – being made redundant. Most of us will have known someone at some time that has been told they are no longer employed.

One of the most common questions – and misunderstandings –is whether or not Income Protection insurance covers redundancy. We have illustrated below the answer to this question and straighten out any misconceptions so you can be prepared for whatever risks can happen to you.

Redundancy – it could happen to you

There is no wonder people are worried about job losses and unemployment in Australia today. The unemployment rate is currently 6.3% – nearly the highest it has been in 10 years. A number of Australian industries, including mining and car manufacturing, have suffered as a result of the GFC.

Sure, it may be the big businesses that are struggling (though the small ones are too!), but the effects of lost revenue ripple down the employee chain to the very last person. Factories shut down and jobs are shed in a bid to save the company. But who’s there to save the individuals who have been cropped from the employee list? And what about their dependents – spouses and children? It is easy to assume that Income Protection would cover you when you lose your job. But it’s not as simple as that.

Does Income Protection cover redundancy in Australia?

The simple answer to this question is no.

Income Protection in Australia provides cover if – and only if – you are unable to work because of a serious illness or injury. In fact unlike in the United States and the United Kingdom, it is against the law in Australia for life insurers to provide unemployment cover in their policies.

If you’re looking at getting income insurance, you should be aware of this important fact: Income Protection does not include redundancy cover. Nor will you be covered if you are fired or if for some reason you have to leave work voluntarily. Don’t be led astray by buying a Life Insurance policy that does not cover everything you think it does.

Can you receive any benefits in Australia if you’re made redundant?

While you cannot receive payments from Income Protection cover if you lose your job, there are alternative forms of support some Australian insurance providers offer. These include:

  • A premium waiver. A number of insurance companies will waive the premium payments of your insurance policy if you are made redundant and so are temporarily unemployed. The premium waiver is usually only available for a certain number of months and is applied only after you have shown evidence that you’re actively seeking alternative employment.
  • An unemployment benefit. If you’re insured with the same company that provides your mortgage, you may have your mortgage repayments covered if you’re involuntarily unemployed for a certain amount of time.

Below are some Life Insurance companies and the features they offer in case of redundancy:

What else can I do to make sure I’m protected?

Just because you won’t be insured for redundancy it doesn’t mean there is no way you can prepare yourself for possible unemployment. Here are a number of things you can do to make sure your income is protected should you be facing redundancy:

Save

It may sound obvious, but it really is that simple. Put aside a bit of your money in case of an emergency. Sure, your savings aren’t inexhaustible and may dwindle quickly when you have to dip into them. But the more you save, the less stress you face if you lose your job.

Get proactive

Reassess your resume, consider a career change or build up your skill set. It doesn’t matter how you go about finding a new job, as long as you remain proactive about it. With a fresh resume and a positive attitude, it will only be a matter of time before you find a new job. For all you know, the redundancy may lead you down a whole new path that will reshape your life!

Understand employee redundancy packages

If you are made redundant, you may be eligible for a redundancy package. This is usually a payout based on your base rate of pay for a certain amount of time. Your redundancy pay entitlement can be calculated on the Australian Fair Work website.

Source: Fair Work Ombudsman

Enter a government employment stream

Some people are reluctant to turn to the government for help when they need it most, but it is still important to know what you may be entitled to. A bit of temporary financial help from the government may be the difference between meeting your basic living expenses or not. The Australian Government offers financial help under the Newstart scheme to those actively pursuing work. The scheme covers you financially during the period in which you are unemployed as you search for alternative work.

We are here for you and everything will be all right.

We understand that you want to have all bases covered so that you and your family are as protected as you can be against all possible risks. Unfortunately, there are some things you simply can’t be covered for in Australia. But if you do your research and are prepared, you can always find ways to make things easier for you during what could be the most difficult time of your life. At Level One, we also aim to make things easier for you, so if you have any concerns or simply want to know more, contact us today.

Quarterly Review April 2015

Market Update

The first quarter for the Australian Share market for the 2015 calendar year was very positive with the ASX/200 closing at 5,891.50 on 31 March 2015. The ASX/200 finished the previous quarter (31/12/2014) at 5,411.80 which is a rather large jump of 480.5 points or 8.88% over the three month period.

February was the best performing month of the quarter up 6.9% following the RBA’s decision to cut the official cash rate from 2.5% to 2.25% – the first interest rate move since August 2013.

The market has continued to edge closer to the 6,000 point mark however we are yet to break through at this point.

High yielding sectors and US Dollar exposed stocks have been the best performers. Resources have continued to underperform and prove very volatile.

The US Federal Reserve has opened the door further for an interest rate hike as early as June, ending its pledge to be “patient” in normalising monetary policy. However the US central bank signalled a more cautious outlook for US economic growth and slashed its projected interest rate path, in a sign that it remains concerned about the health of the recovery.

In its statement following a two-day meeting, the Fed’s policy-setting committee repeated its view that job market conditions had improved and gave its strongest signal to date that it was nearing its first rate hike since 2006. The statement put a June rate increase on the table, though it also allowed the Fed enough flexibility to move later in the year, stressing that any decision would depend on incoming data.

“The committee anticipates that it will be appropriate to raise the target range for the federal funds rate when it has seen further improvement in the labour market and is reasonably confident that inflation will move back to its 2 per cent objective over the medium-term,” the Fed said in its statement.

For the 2015 calendar year to date the Australian dollar has dropped US$5.44 or 6.65% falling from US$81.84 on 31st December 2014 to close the quarter at US$76.40 on 31st March 2015. While the drop in our dollar isn’t good for people travelling overseas it is good for many Australian companies and the Reserve Bank of Australia has publically stated that it would like to see the Australian dollar weaker still. A lower Australian dollar would improve the competitiveness of Australian manufacturers and should provide a boost to the tourism market from international travellers.

Iron ore completed the biggest quarterly loss since at least 2009 as surging low-cost supplies from Australia and Brazil swamp the global market, spurring a glut as demand from China slows. The commodity capped a fifth quarterly retreat on Tuesday after Rio Tinto Group and BHP Billiton expanded supply, betting increased volumes would offset lower prices and force higher-cost miners to close.

Economic Update

The Reserve Bank of Australia (RBA) reduced the cash rate in February by 25 basis points to 2.25%. Another rate decrease is expected in the coming months; however this month the RBA kept the cash rate on hold. The RBA stated at its latest meeting “Moderate growth in the global economy is expected in 2015, with the US economy continuing to strengthen, even as China’s growth slows a little from last year’s outcome.” The RBA has assured us that they will be watching the economic data closely over the coming months and take action where required to spur growth.

The falling Australian dollar has brought a smile to many faces throughout Australia. It is presently the single most important driver of rebalancing an economy tilted towards servicing the mining boom over the last 10 years to non-mining led growth. With the Australian dollar now lower, there has already been an initial recovery in tourism, both inbound and domestic. That will be joined by education, agriculture, business services and even mining and manufacturing. The recent fall in the dollar has helped, but more is required.

It is believed that allowing for the rise in the US dollar, the Australian dollar needs to be below US 70 cents for our export and import-competing industries to be competitive on average. The view is that it will get there — but it will take time. In the interim, the economy remains in a holding pattern, waiting for business investment in the non-mining sectors to pick up and push the economy towards long-run trend growth.

Non-mining business investment, particularly in equipment, computer software and research & development, remains weak, weighed down by soft demand and weak profits, with businesses focussed on cutting cost and deferring investment — a legacy of the GFC. When demand finally picks up, a recovery in growth will absorb excess capacity allowing firms to shift from cost-cutting to one of increased appetite for investment. We think that is at least a year away, possibly more.

Overall, this is not a business-as-usual economy. We are on a threshold of structural change, switching from a mining investment-driven economy back towards balanced growth. The quicker the dollar falls to below US 70 cents, the faster we transition to a balanced economy. Growth in the interim is being supported by an upswing in dwellings building, solid private consumption expenditure and strong resource exports.

The slow pace of employment growth over the past three years has not kept pace with the growth in the labour force (the number of people working or available and actually looking for work). This has resulted in the unemployment rate rising from 5 per cent in May 2011 to 6.4 per cent in January 2015 (seasonally adjusted).

Weak growth and cost containment logic implies that employment growth will remain weak over the next 18 months. Even stronger businesses are cutting, governments are also cutting. Miners are cutting costs including labour to preserve profitability in the face of lower commodity prices.

The unemployment rate will increase a little, and stay stubbornly high until stronger growth and employment growth start to claw it back.

We expect the economy to remain weak for another 18 months before strengthening non-mining business investment (underwritten by a lower dollar and tightening capacity) pushes the economy closer to its potential. But it will be a ‘soft cycle’ as the potential growth rate of 3.25 per cent is unlikely to be realised on average. The next round of infrastructure and mining projects, plus another cycle in dwellings building (we will still have a deficiency of housing stock at the end of the current cycle), is expected to drive stronger growth towards the end of the decade.

Australia’s GDP growth for 2014/15 and 2015/16 is forecast to be 2.6 and 2.9 per cent respectively. This is a reasonable expectation considering the calendar year growth for 2014 was 2.7.

The chart below shows the GDP growth over the last 20 years:

Property Market Update

The rate of value growth is slowing across all cities except for Sydney

Home values rose by 1.4% in March, increasing in all cities except Brisbane and remaining unchanged in Adelaide

Home values have increased by 3.0% over the first quarter of 2015 however, Sydney, Melbourne, Hobart, Darwin and Canberra are the only cities in which values have increased

The value growth performance has been extremely varied over the past year. Sydney (13.9%) has been much stronger than other capital cities while Melbourne (5.6%) has recorded moderate growth while increases have been minimal in Brisbane (2.7%), Adelaide (2.2%) and Canberra (1.5%). Home values have fallen over the past year in Perth (-0.1%), Hobart (-0.3%) and Darwin (-0.8%).

Sales activity across the country is slightly higher than at the same time last year

Over the 12 months to January 2015 there were 351,187 houses and 135,540 units sold across the country

House sales are 3.0% higher over the year compared to a -5.3% fall in unit sales

Vendor metrics indicate quite strong housing market conditions

Auction volumes have surged since the RBA cut interest rate in February and clearance rates have also recorded a sharp rise and are at their highest level since 2009

Discounting levels remain low while time on market is recording its usual seasonal spike albeit the spike is lower than a year ago

New and total listings are lower than at the same time last year

New listings are -10.4% lower than a year ago nationally and -13.3% lower across the capital cities

Mortgage demand has rebounded strongly following the Christmas / New Year period

The RP Data Mortgage Index (RMI) shows that mortgage demand rebounded strongly in March 2015

ABS housing finance data to January shows the market growth is largely being driven by investors and owner occupier refinances

Economic data flows remains mixed

Population growth is winding down but remains high on an historic basis

Dwelling construction approvals hit a record monthly high in January and recorded their second highest ever month in February and remain at a record high on an annual basis

With population growth slowing and building approvals remaining high (despite the recent fall) we may see a better relationship between approvals and population growth over the coming years

Consumer sentiment has been weak since the 2014 Federal Budget and after rebounding into positive territory in February fell to negative in March

The unemployment rate eased slightly over the month but remains at levels not previously seen in more than a decade

Source: RP Data

Negative Gearing for Property Investors

Negative gearing is arguably the most generous tax break available to Australian property investors.

Whether you’re an established property investor or contemplating purchasing your first investment property, you may care to familiarise yourself with the way that negative gearing works.

A property is considered to be negatively geared if the owner has taken on debt in order to acquire it and the net rental income is less than the costs of maintaining the property (including the interest paid on the loan).

Investors with negatively geared properties are able to claim the shortfall between their associated costs and rental income as a deduction against their total taxable income.

In the event that your taxable income is insufficient to absorb the difference, then the remaining deduction can be carried forward to the next financial year.

Many Australians would not be able to enter the real estate market without taking on some form of debt. While taking on debt allows you to make investments that would otherwise have been beyond your reach, it also ramps up your risk profile because you will have a greater amount invested. Furthermore, if your investment property is underperforming, you remain responsible for making loan repayments.

Obviously, it is preferable to have an investment property that is positively geared, meaning that rental income covers loan repayments, interest and routine maintenance. Paying tax on a profit is typically considered to be a better option than minimising your tax liability while making a loss. Investors who have long term negatively geared properties are generally hoping to incur long term profits from capital growth.

Even if you think that your investment property will be positively geared, understanding the benefits of negative gearing can give you a little peace of mind. You know that if the property does lose money, you will be able to offset the loss against your taxable income.

When a property is positively geared, the income earned is added to your total taxable income. As such, it is taxed at your marginal tax rate. The same applies to any capital gain that you make from selling a property.

Property Damage Considerations for Investors

There is nothing more tedious for rental property owners than dealing with the tax implications of damaged property.

Over the past year, natural disasters have severely impacted areas throughout Australia, leaving rental property owners especially feeling the brunt of these disasters through costly repair bills and loss of rental income.

It is important for those affected to understand the tax consequences of the repairs. To ensure you can claim as much of your costs as possible, owners must be aware of these crucial issues:

  • The cost of travel to the property to survey destruction is deductible and includes transport, accommodation and meal expenses.
  • Repair costs are deductible. However, different rules apply for the work that goes beyond restoring to the original condition. A tax deduction is allowed for the full cost of the repair within the year it is completed, while additional improvement costs will be depreciated as either a part of the building or as a separate asset.
  • Demolition and cleanup costs are deductible, but the claim amount is limited to the income received from the insurance payout and any income received from selling scrap materials.
  • Insurance payouts for loss of rental income are taxable, as are insurance proceeds for repairs, where repairs are undertaken.
  • Interest on loans used to pay for property damage will be deductible for the life of the loan.
  • Ongoing property holding costs are tax deductible while there is no rental income. However, you must intend to restore the property and then continue renting it.

There could be capital gains tax consequences where the property is completely destroyed and the insurance payout is classified as the sale of your building. It is crucial to consider this implication with an accountant as every case is different.

Individuals can also apply to the ATO to vary the PAYG tax withheld from their salary or wages, to reflect their ongoing property investment expenditure. This option is only available for periods of up to one year and a reapplication must be made each year to extend this period.

Superannuation and Intergenerational Wealth Transfer

Increasing life expectancies and significant wealth accumulation in superannuation are set to transform the way that intergenerational wealth transfer occurs.

Younger generations are likely to have to wait until they are older, in many cases much older, to receive their inheritance. The family home may also lose its status as the central mechanism of intergenerational wealth transfer. With superannuation balances soaring, especially in SMSFs, it seems that many Australians will leave some super behind.

While all of this is good news, it does raise an issue: younger people may not be able to depend on inheritance to give them a financial kick start in life. For example, providing the deposit for a first home. For this reason, some Australians want to think about distributing some of their superannuation nest egg while they are still alive.

An advantage to doing this is that you will be able to enjoy seeing your beneficiaries spend their inheritance, and influence their decisions, if this is something that is important to you.

One alternative to gifts of straight cash can be to include your children in your SMSF and ensure that they will be the beneficiaries of your portion when you pass away.

Carefully accounting for your superannuation in your estate planning is also very important, and something that is often mismanaged.

Update on Employment Laws

The start of the new financial year has brought about some important changes to employment laws.

All employers have a responsibility to remain up to date and aware of any amendments made to employment laws, to ensure that they remain compliant and continue to meet their obligations.

Below are four important changes that took effect from 1 July 2015:

Salary cap for unfair dismissal

The high income threshold increased from $133,000 to $136,700 per annum. Because the threshold includes allowances and benefits, employees and employers should remain aware of how salary packaging can affect their eligibility to meet the new requirements.

Recent unfair dismissal cases have demonstrated that even though an employee’s base salary may be below the high income threshold, any additional benefits can be classified as “earnings”. These earnings can push an employee’s base salary over the threshold, making them ineligible for unfair dismissal remedies (if they are not covered by an enterprise agreement or modern award).

Before dismissing a high income employee, employers need to be aware that employees who earn over the threshold may still have other legal avenues to challenge dismissals. These options include anti-discrimination laws and the Fair Work Act’s general protections provisions. Therefore, to protect themselves against any type of challenge, employers should take the necessary steps to understand their position before dismissing an employee.

Minimum wages

The modern award minimum wage rates rose 2.5 per cent, and the National Minimum Wage increased to $656.90 per week (or $17.29 per hour) for employees who are not covered by an award or agreement. However, employers who employ staff that are not covered by any age or disability percentage rate are exempt from the change, and may pay less than the National Minimum Wage.

The changes bring about the need for employers to make sure that their rates do not fall below the new minimum wages rates. Even if their employees are already paid above the minimum wage or modern award rates, employers should review their rates nonetheless.

The same goes for any employees who are employed under an enterprise agreement. Employers should check that the base rates in their agreement remain at least equal to the new minimum Modern Award rates.

Employees should also check what their current pay rates are, and ensure that any applicable increases have been applied to their first full payslip for the period on or after July 1, 2015.

Superannuation Guarantee

The maximum cap for superannuation contributions increased to $203,240 per annum. However, the Superannuation Guarantee rate will remain at 9.5 per cent until 30 June 2021, and will increase to 12 per cent by 1 July 2025.

The delay in an increase has significant financial implications for those expecting to remain in the workforce for more than 12 years. This is because the 3 per cent increase will take effect from the start of the 2025-26 year (in 12 years’ time (under the new laws), rather than in five years’ time (under former SG laws).)

Redundancy tax concessions

The tax free threshold that applies to genuine redundancy payments will increase, affecting employers with employees who are entitled to a redundancy payment. From 1 July 2015, the tax free base limit in a valid redundancy payment will increase to $9,780, and the tax free limit per year of service will increase to $4,891.

ATO Focuses on Rental Property Deductions

This tax season will see the ATO specifically targeting extreme or inappropriate deductions made by rental property owners.

While it is not uncommon to make some mistakes when claiming rental deductions, it is necessary for taxpayers with rental property interests to get their deductions and expense claims right to avoid facing harsh and costly penalties. Last year, the ATO contacted more than 350,000 taxpayers about omissions and errors in their returns.

This 2015-16 financial year will see the ATO increasing its focus on four main problem areas where rental property owners are incorrectly, whether by error or design, claiming deductions that don’t necessarily suit their circumstances. These include:

Claiming excessive deductions

The ATO recently amended deductions claimed for a holiday home. Deductions may only be claimed for the periods when the holiday house property was rented out, or when it was genuinely available for rent. Deductions should also be limited to the amount of income earned by the property owner when the property is rented out below the market rate to family or friends.

Partners splitting income and deductions

Husbands and wives who own property together, but divide the income and deductions unequally to receive a tax advantage for the higher income earner, will be heavily penalised by the tax office. These kinds of arrangements will attract higher penalties if the ATO believes that they are carried out deliberately.

Repairs or maintenance claims

The ATO will carefully examine any repair and maintenance costs incurred by a property owner after a property is bought. These ‘initial repairs and improvements’ costs to a property are generally not deductible, but can be added to the capital cost of the property.

Claiming for interest deductions

Interest expenses incurred for a rental property are only deductible when the property is used to produce rental income. For example, those who own a two-storey house and live privately in the bottom storey but lease out the top storey can only claim 50% of the interest expenses. Property owners must be aware that any interest expense incurred from the private use of a property is non-deductible.

Scam Alert: myGov Tax Refund Scam

In the latest email scam that is circulating, scammers are using the Australian Taxation Office (ATO) logo to make their email look authentic. This email indicates that you may have a tax refund and asks you to click on a link which takes you a website using myGov logos (see below).

If you receive an email such as this – do not click any links. Forward it to and delete the email immediately.

REMEMBER: the ATO will NEVER email or SMS you and request personal or financial information.

If in doubt please contact us for assistance.

Federal Budget 2015-2016 – The ‘Have a Go’ Budget

Overview

Budget 2015 is about fairness, families and small business, with a smiling Treasurer encouraging Australia to ‘get out there and have a go’.

In describing his second Federal Budget the Federal Treasurer, Joe Hockey said ‘This Budget is measured, fair and responsible’ and is designed to promote ‘jobs, growth and opportunity’.

The Federal Budget speech delivered an upbeat outlook for Australia’s economic future and confirmed a number of measures that had been announced pre-Budget.

For the second year running no new taxes on superannuation were introduced, however some changes have been made to the Age Pension. These measures will increase the number of people eligible for a full Age Pension but reduce the level of assets at which a part Age Pension is received.

A number of measures were introduced to encourage growth in small business, including a reduction in the company tax rate to 28.5% for small business, and an immediate tax deduction for items valued less than $20,000.

Social security measures primarily deliver a range of changes for families including the introduction of a single child care subsidy which is means tested. This long-awaited child care reform will simplify access to child care with a focus on lower and middle income families, as well as families with disadvantaged children.

In addition to these changes, the Government abandoned the changes to the indexing of the Age Pension and the resetting of the deeming thresholds.

A number of personal income tax measures aim to modernise taxation methods including changes to the tax deduction of car expenses, caps on fringe benefits and subjecting GST to offshore digital services, like Netflix, provided to Australian consumers.

However, big ticket tax reform measures remain for consideration in the Tax Reform White Paper and pre-Budget speculation that a new 0.05% tax would apply to bank deposits of up to $250,000 was not included in the Budget measures.

The key issues of the budget and how they may affect you are detailed below.

Important Note: Before any of these announcements can be implemented, they will require passage of legislation, which will remain challenging.

Age Pension & Disability Support Pension

Increase in Assets Test thresholds

From 1 January 2017, the Assets Test thresholds for the full pension will be increased. The current and proposed thresholds are detailed below:

Assets Test threshold for full pension
(20 March 2015)
Assets Test threshold for full pension
(1 January 2017)
Single, homeowner$202,000$250,000
Single, non-homeowner$348,500$450,000
Couple, homeowner$286,500$375,000
Couple, non-homeowner$433,000$575,000

Increasing of the Assets Test taper rate

From 1 January 2017, the Assets Test taper rate will increase from $1.50 to $3.00, effectively reversing the 2007 decision to halve the taper rate at that time. The current and proposed thresholds are detailed below:

Assets Test threshold for part pension
(20 March 2015)
Assets Test threshold for part pension
(1 January 2017)
Single, homeowner$775,500$547,000
Single, non-homeowner$922,000$747,000
Couple, homeowner$1,151,500$823,000
Couple, non-homeowner$1,298,000$1,023,000

Comment:

Pensioners who lose their pension entitlement on 1 January 2017 as a result of these changes will automatically be issued with a Commonwealth Seniors Health Card or a Health Care Card (for those under Age Pension age).

Impact of increase in Assets Test thresholds and taper rates on pensioners

• The proposed new taper rates and Assets Test thresholds mean some pensioners will receive a higher fortnightly pension, while others will see their pension reduced. The following table approximates the level of assets above which the pension (under the Assets Test) will reduce due to the proposed measures compared to current entitlements.

Asset level above which pensions (under the Asset Test) are reduced due to the proposed measures
(from 1 January 2017)
Single, homeowner$289,500
Single, non-homeowner$537,000
Couple, homeowner$451,500
Couple, non-homeowner$699,000

Aged Care

Rental Income Exemption Removed

The rental income exemption under the aged care means test, for aged care residents who are renting out their former home and paying their aged care accommodation costs by periodic payment, will no longer apply. This applies to new residents entering aged care from 1 January 2016.

Personal Income Tax

Increase to Medicare Levy Low-Income Threshold

The Government will increase the Medicare levy low-income threshold for families from the 2014-15 financial year. The threshold for couples with no children will be increased to $35,261 per annum and the additional amount of threshold for each dependent child or student will be increased to $3,238 per annum.

The increase in these thresholds takes into account movements in CPI. There will also be an increase to the annual Medicare Levy low-income thresholds for individuals ($20,896) and pensioners ($33,044).

Changes to claiming a tax deduction for car expenses

The Government will modernise the methods of calculating work-related car expenses from the 2015-16 financial year. In doing so the ‘12% of original value method’ and the ‘one third of actual expenses method’, will be removed. The cents-per-kilometre rate will be modernised by replacing the three current rates based on engine size with a single rate of 66 cents per kilometre. In addition they will retain the ‘logbook method’ of calculating expenses. The Government has indicated this will not impact leasing and salary sacrifice arrangements.

Small Business Taxation

Tax Cuts for Small Business

From the 2015-16 financial year, the Government will reduce the company tax rate to 28.5% for companies with aggregated annual turnover less than $2 million. Companies with an aggregated annual turnover of $2 million or above will continue to be subject to the current 30% rate on all their taxable income.

The current maximum franking credit rate for a distribution will remain unchanged at 30% for all companies, maintaining the existing arrangements for investors, such as self-funded retirees.

Individual taxpayers with business income from an unincorporated business that has an aggregated annual turnover of less than $2 million will be eligible for a small business tax discount. The discount will be 5% of the income tax payable on the business income received from an unincorporated small business entity. The discount will be capped at $1,000 per individual for each income year, and delivered as a tax offset.

Comment: This lowering of the tax rate was an expected measure to encourage small business investment in difficult economic times. The Government hopes that the difference between the tax rates is great enough to benefit small business but also low enough to incentivise small businesses to grow. It is interesting that the Government has left the franking credit rate at 30% for all companies, allowing small business owners to maintain the higher level of tax advantages associated with franked dividends.

Immediate tax deduction for items valued less than $20,000

Small businesses with aggregate annual turnover of less than $2 million can immediately deduct assets they start to use or install ready for use, provided the asset costs less than $20,000. This will apply for each asset acquired and installed ready for use between 7.30pm (AEST) 12 May 2015 and 30 June 2017. Assets valued at $20,000 or more (which cannot be immediately deducted) can continue to be placed in the small business simplified depreciation pool (the pool) and depreciated at 15% in the first income year and 30% each income year thereafter. The pool can also be immediately deducted if the balance is less than $20,000 over this period (including existing pools).

The Government will also suspend the current ‘lock out’ laws for the simplified depreciation rules (these prevent small businesses from re-entering the simplified depreciation regime for five years if they opt out) until 30 June 2017.

From 1 July 2017, the thresholds for the immediate depreciation of assets and the value of the pool will revert back to existing arrangements.

Social Security

Cessation of the Low Income Supplement

From 1 July 2017, the Government will cease payment of the Low Income Supplement. Currently a Low Income Supplement of $300 per year is paid to people whose income was below certain thresholds and who did not receive a pension or benefit from the Australian Government for more than 39 weeks in the previous financial year.

Increase in Pharmaceutical Benefits Scheme safety net threshold

The Government will extend the increase to the Pharmaceutical Benefits Scheme (PBS) safety net thresholds by one additional year in 2019. This builds on the 2014-15 Budget measure to increase the PBS safety net thresholds for four years from 1 January 2015.

Removing double-dipping from Paid Parental Leave

From 1 July 2016, the Government will remove the ability for individuals to take Parental Leave Pay (PLP) from the Government in addition to any employer-provided parental leave entitlements. Currently individuals can double dip, by taking payments from both the Government and their employer.

The Government will ensure that all primary carers would have access to parental leave payments that are at least equal to the maximum PLP benefit (currently 18 weeks at the national minimum wage).

Introduction of a single Child Care Subsidy (CCS)

From 1 July 2017, the Government will replace the Child Care Benefit, Child Care Rebate and the Jobs, Education and Training Child Care Fee Assistance programs with a new, single, means-tested Child Care Subsidy (CCS).

Families meeting the activity test with annual incomes up to $60,000 will be eligible for a subsidy of 85% of the actual fee paid up to an hourly fee cap. The subsidy will taper to 50% for eligible families with annual incomes of $165,000.

The hourly fee cap in 2017-18 will be set at $11.55 for long day care, $10.70 for family day care, $10.10 for outside school hours care and $7.00 for a nanny in a child’s home (pilot program from 1 January 2016). The hourly caps will be indexed by CPI.

Eligibility will be linked to a new activity test to better align receipt of the subsidy with hours of work, study, or other recognised activities.

The CCS will have no annual cap for families with annual incomes below $180,000. For families with annual incomes of $180,000 and above the CCS will be capped at $10,000 per child per year.

The income threshold for the maximum subsidy will be indexed by CPI with other income thresholds aligned accordingly.

Insurance: Inside Super vs Outside Super

Whether it is better to hold insurance inside or outside superannuation depends on you, your financial situation and motivations.

To help with making this decision, the following table provides a quick overview of the main advantages and disadvantages for insurance inside superannuation.

ADVANTAGESDISADVANTAGES
Reduce pressure on cashflow:
• Premiums can be paid from accumulated savings or employer contributions instead of disposable income
Reduced claim benefits:
• Only benefits that meet the sole purpose test can be paid – may lose some features otherwise available outside super
Easier access:
• No (or minimal) underwriting for group insurance arrangements (up to specified limits)
Tax on claims:
• Beneficiaries could pay tax up to 30% plus Medicare and other levies on claims received
Lower effective cost of premiums:
• Salary sacrifice or deductible contributions may be used to pay premiums from pre-tax earnings
Delays in receiving claims:
• Once a claim has been approved and is paid to the super fund trustee, the trustee needs to then follow procedures to pay the super benefit
• The timeframe can be lengthy if disputes arise (eg up to 2 years if resolved through super complaints tribunal)
Claim strategies:
• May have choice and flexibility to receive benefits as lump sum or tax-effective income stream
May need more than one policy:
• Trauma and TPD (own occupation) can no longer be commenced inside super so may need separate non-super policies – this may result in higher total policy fees
Restricted beneficiaries;
• Only the member can be paid a disability benefit
• Beneficiaries of a death benefit are limited under SIS legislation
Diminished retirement savings:
• Payment of the premiums reduces accumulated savings unless additional contributions are made

Most of the benefits of holding insurance inside superannuation focus on making insurance more accessible and the effective cost cheaper. But problems can occur when a claim is payable. It is important that our advice to you includes a full comparative analysis.

What’s Really Happening With Property?

There’s little doubt that property is an attractive investment option for many, but with the media reporting conflicting news about the Australian property sector, it can be difficult to understand what’s really going on.

Many people considering an investment in property have a preference for direct property; residential, industrial or commercial. Among other reasons, this popularity may be driven by an economy that is currently living with record low interest rates.

Alternatively, property trusts offer small-scale investors the opportunity to invest in properties not directly accessible to them, such as large retail developments or overseas projects.

Over recent years, however, there’s been increasing confusion among commentators about just where Australian property sits on the boom and bust cycle. Who do you believe?

Then and now

This table shows the average returns for Australian direct property compared with Australian property trusts from 2007 to 2014.

Year:Property TrustDirect Property
(Income)
Direct Property
(Capital Return)
200725.9%7.5%10.5%
2008-36.3%8.0%-5.5%
2009-42.3%0.0%-8.5%
201013.8%-1.5%2.0%
20115.8%8.0%2.5%
2012-7.0%7.5%1.5%
20137.3%6.0%7.0%
201427.0%3.5%9.8%

It is evident that while income returns from direct property have remained reasonably stable, the capital value of the property sector has experienced its fair share of ups and downs.

This second table compares the property trust sector with Australian shares. It is possible to see that both have experienced low points but no general pattern of recovery is discernable.

Year:20072008200920102011201220132014
Shares:30.3%-12.1%-22.1%20.4%12.2%11.0%24.2%5.3%
Property:25.9%-36.3%-42.3%13.8%5.8%-7.0%20.7%26.8%

As with all investments, there is a need for diligence. Determining if property investment is the way forward for you is only part of the question. Property tends to have a higher emotional attachment than other assets, so it’s wise to speak to a trusted professional adviser to obtain a clearer perspective before you make a final decision.

Treating Employees as Contractors

The structure of the workforce is transforming, and many business owners are struggling to make sense of the rapid changes.

The problem is that regulation, especially from the tax office, will always be a few steps behind changes that are happening in the real world. Sadly, this often means that compliance requirements are not befitting to current business practices. An area where this is glaringly apparent is the tax treatment of independent contractors vs employees.

The option to hire independent contractors increases flexibility, expertise and access to equipment, making it attractive to small business owners. Furthermore, many Australian workers are increasingly opting to work freelance instead of seeking permanent employment.

Unfortunately, business owners are often surprised to find out that there can be some severe penalties for incorrectly treating an employee as an independent contractor for tax purposes. The ATO’s definitions of an employee and an independent contractor are fairly strict, and tend to come down on the side of classifying people as employees.

Businesses that incorrectly treat employees as contractors can face a set of heavy financial penalties including missed PAYG payments and super guarantee charges for missed superannuation payments. The super guarantee charges will include the actual super guarantee amounts (currently 9.5% of the employee’s gross pay) and penalties.

The ATO uses a combination of compliance and education to help employers ensure that they are correct in their tax treatment of workers.

Generally, an independent contractor will have a high degree of flexibility over their work, provide their own equipment, and will accept risk and liability for poor work. Independent contractors are required to pay their own taxes and make decisions in regards to how much income to contribute to their superannuation accounts.

Employees, who perform work under the direct supervision of their employer, should not take on risk for their own work and have their superannuation paid by their employer. Employees have their taxes paid through the PAYG system.

Employers should note that even if a person has been treated as an independent contractor, they may still be eligible to file for unfair dismissal claims.

In the event that you are unsure as to whether or not your tax treatment of employees and independent contractors is compliant, seek advice from our office.

While there are many financial advantages to having independent contractors in place of employees, for example avoiding the super guarantee and payroll tax, you will likely suffer in the long run if you continue to be non-compliant.

Budget Focus on Stimulating Small Business Activity

The Budget has introduced a number of measures for small businesses designed to revive investment and support entrepreneurship and startups.

Tax cuts

The Government has followed through with its announced 1.5 per cent tax cut for small businesses with an annual turnover of less than $2 million, which will take effect from 1 July 2015. The Government will also provide a 5 per cent tax discount (capped at $1000) for small businesses that are unincorporated with an annual turnover of less than $2 million, such as sole traders and trusts.

Accelerated depreciation

Businesses that invest in new tools or machinery will receive an immediate tax deduction for any individual assets under $20,000 from 12 May 2015 until 30 June 2017. Currently, the threshold sits at $1,000. They can apply the $20,000 limit to as many individual items as they wish.
Assets that extend the $20,000 limit will be added to the entity’s small business pool and depreciated at 15 per cent in the first income year and 30 per cent each income year thereafter. These were the current rules for assets costing $1000 or more. The Government will also suspend the current lock-out laws for the simplified depreciation rules. These will prevent small businesses from re-entering the simplified depreciation regime for five years if they opt out until 30 June 2017.

Measures encouraging business startups

In order to encourage business start-ups, business registration processes will be streamlined through the creation of a single website (business.gov.au), which allows new businesses to register using a one key identifier. The new online portal will be implemented by mid 2016. The Government will also change the regulatory framework for crowd-sourced equity funding, including simplified reporting and disclosure requirements, to provide small businesses with access to additional funding from innovative sources.

Business establishment costs

Small businesses will be able to immediately write off professional costs associated with starting up a company from the 2015/16 income year instead of over a five-year period. Business owners will be able to invest more money into the growth of their new business.

CGT relief reforms for small business

A new CGT relief measure will be available for small businesses that change their legal structures and do not necessarily involve incorporated entities from the 2016/17 income year. However, small businesses can only apply changes to the legal structure once.

Quarterly Review July 2015

Market Update

The final quarter for the Australian Share market for the 2014/2015 financial year was negative with the ASX/200 closing at 5,459 points on 30 June 2015. The ASX/200 finished the previous quarter (31/03/2015) at 5,891.50 which equates to a drop of 432.5 points or 7.34% and effectively wiping off the gains for the first quarter for 2015. The ASX/200 increased from 63.3 points or 1.17% over the 2014/15 financial year.

Asset Class Returns to 30 June 2015

3 month %1 year
% pa
2 year
% pa
3 year
% pa
5 year
% pa
10 year
% pa
Cash0.62.62.62.93.74.7
Australian bonds-2.05.65.94.86.46.3
Australian property securities-2.320.215.618.314.22.3
Australian shares (accumulation index)-6.65.711.415.19.77.1
Global shares (hedged)0.211.017.019.016.18.9
Global shares (unhedged)-0.124.322.125.114.76.9

Asset class data: Bloomberg AusBond Bank Bill Index (cash), Bloomberg AusBond Composite 0+ Yr Index (Aust bonds), S&P/ASX300 A-REIT Accumulation Index (Australian property securities), , S&P/ASX200 Accumulation index (Aust shares) and MSCI All Country Indices hedged and unhedged in A$ (global shares hedged and unhedged).

The most significant contribution to the recent sell-off and relative underperformance stems from the heavy sell-off in the Banks sector from mid-April to early-June (albeit following a strong rally in the first quarter of 2015) as regulatory/capital concerns re-emerged and as Bank reporting season underwhelmed. Another noteworthy source of weakness in the Australian market has been the Consumer Staples sector on rising competition concerns.

The Year Ahead

Our equities research is sourced from UBS Wealth Management and we outline the following:

Best Prospects For 2015

We remain underweight in the Mining sector, REITs, Telcos, Consumer Staples and General Insurance.

We remain overweight USD earners, housing construction plays and Energy.

Australian Dollar Still Has Downside–Which Would Be Good For Earnings

While any additional long bond sell-off driven by a reassessment of the degree of Fed tightening should be contained, it should nevertheless provide the next down leg in the Australian dollar. We target 70c over the next 6-12 months. This should help the economy and the corporate earnings outlook though admittedly A$ weakness is an intermediate consideration for unhedged US$-based investors and for domestic investors weighing up the current merits of local versus overseas shares.

Year End Target

While the global backdrop is likely to remain relatively benign, our view is that local valuations are still somewhat elevated in an absolute sense. We don’t see big downside to earnings but equally they don’t see significant upside particularly with banks (capital) and miners (iron ore) likely to face further challenges. Our year end target for the ASX200 index is 5,800 (previous 5,900) which represents just over 2% potential upside from current levels (pre-dividends).

Economic Update

The Reserve Bank of Australia (RBA) reduced the cash rate further in May by 25 basis points to 2%. This decision came on the back of further declines in commodity prices and our falling terms of trade.

RBA Governor Glenn Stevens stated after their meeting in May “Low interest rates are acting to support borrowing and spending, and credit is recording moderate growth overall, with stronger lending to businesses of late. Growth in lending to the housing market has been steady over recent months. Dwelling prices continue to rise strongly in Sydney, though trends have been more varied in a number of other cities. The Bank is working with other regulators to assess and contain risks that may arise from the housing market. In other asset markets, prices for equities and commercial property have been supported by lower long-term interest rates.”

June and July saw rates left on hold and we still anticipate rates to be kept low for the remainder of 2015 at least.

Unexpectedly in May, unemployment dropped to 6% – a one-year low. The number of people employed rose by 42,000, almost 3 times the forecasted gain.

Consumer confidence has increased up to its highest point in 18 months (see chart at end). This is an encouraging sign for domestic spending in the period ahead. Economists are positive that this lift is the beginning of an upward trend. The decrease in the unemployment rate and improving labour market conditions across some industries are believed to be the driving force here. This will be a statistic to watch over the coming months.

Our gross domestic product (GDP) grew above expectations in the first quarter of 2015. The Australian Bureau of Statistics reported that GDP expanded 0.9% in the three months to the end of March, compared with 0.5% in the preceding quarter. The increased activity and demand for housing construction has played a significant part in this result.

The Australian dollar is still buying around US$0.76 at present. This remained reasonably steady over the last quarter, although mid-May saw the price hike to around US$0.80. To see most Australian trade-exposed industries the dollar needs to fall further; somewhere in the region of US$0.58 to US$0.70 would achieve this. Although this is a broad range this reflects the differences in competitiveness.

Tourism is still enjoying the decline in the dollar and the flow on effect is starting to show. Tourist facilities are getting a much needed revamp and planning and construction of new tourist facilities is underway. It is great to see the industry making up lost ground after almost a decade in the doldrums as a result of the high Australian dollar. Five years from now, Tourism, the industries that service it and the regions in which they are located, will be booming!

Meanwhile, recovery in new private capital expenditure in ‘other selected’ (mainly service) industries is hampered by weak revenue, profits and excess capacity. Until we see a sustained improvement in demand and profits, investment will remain weak.

This is not a steady state economy and growth remains below par. The fall in mining investment is a negative shock to growth, somewhat offset by continued strength in mining production, private consumption, and the recovery of dwellings investment. Broad based recovery will eventually transpire but it will take some time. It will start with the trade-exposed industries. The Tourism sector is first cab off the rank. But other trade-exposed industries will follow, tailed by a broadening of the recovery throughout the service industries.

Property Market Update

As subscribers to CoreLogic RP Data research we outline below a brief summary of their June Property Update:

June home value results capital city dwelling values finished the 2014/15 financial year on a strong footing, with dwelling values rising 2.0% over the June quarter and 9.8% higher over the year. The rate of capital gain was slightly higher over the second half of the year (5.1%) compared with the first half (4.5%) highlighting that the housing market has gathered some momentum during 2015. The previous 2013/14 financial year recorded a slightly higher rate of growth at 10.1%.

No doubt interest rates cuts in February and May have contributed in pushing capital gains higher.

Growth conditions had been moderating from April last year through to the end of January 2015. With the RBA cutting the cash rate in February, there was an instant buyer reaction across the Sydney and Melbourne housing markets where auction clearance rates surged back to levels not seen since 2009, capital gains once again accelerated and we are now seeing Sydney and Melbourne homes selling in record time; Sydney homes are selling in just 26 days and Melbourne homes are selling in 32 days.

The strength in the housing market has been diverse over the year. While Sydney and Melbourne have seen dwelling values increase by 16.2% and 10.2% over the financial year respectively, every other capital city has seen growth of less than 5% and dwelling values are down over the year in Darwin (-2.9%) and Perth (-0.9%).

The current housing growth cycle clearly highlights a divergence in capital gains across the capital cities. Since dwelling values started rising in May 2012, Sydney dwellings have seen a 43.1% surge in values and Melbourne values are up by 25.9%. Despite softer market conditions in Perth, dwelling values are currently up 12.8% over the cycle which represents the third highest growth rate across the capitals. Simultaneously, Brisbane’s property market has shown the fourth highest rate of growth at 12.4%, followed by Adelaide (10.4%), Hobart (9.6%), Darwin (8.9%) and Canberra (8.8%).

The three tiers of housing market performance can be best explained by economic and demographic factors where it’s no coincidence that New South Wales and Victoria are recording the strongest economic conditions coupled with the strongest rates of migration which is fuelling housing demand. These states are more sheltered from the mining sector downturn and have benefited from the strong multiplier effect of housing construction as well as a vibrant financial services sector.

The Perth and Darwin markets are weakening in line with the downturn in the resources sector and an associated weakening in infrastructure investment and a marked slowdown in migration. Brisbane, Adelaide, Canberra and Hobart are seeing softer economic conditions and population growth compared with Sydney and Melbourne, however housing markets have shown some level of growth over the year.

Looking at the performance of detached housing versus apartments over the financial year, houses are clearly outperforming units in the capital gains stakes. Over the financial year, house values were 10.4% higher across the combined capitals index while unit values increased by a much lower 5.6%. The same trend where houses are showing a higher capital gain than units is evident across each of the capital cities except Hobart and Darwin.

Today’s results confirm a scenario where detached housing outperforming apartments is most evident in Melbourne. Based on the results, Melbourne house values have shown a very strong 11.2% capital gain over the financial year while apartment values are up by only 2.4%.

The underperformance of units compared with houses is likely due to higher supply levels for units compared with detached houses. The Inner Melbourne unit market exemplifies the weakness in this sector where the latest CoreLogic RP Data ‘Pain and Gain’ report revealed that almost one quarter of all apartments across the Inner Melbourne region resold over the March quarter at a price that was lower than the purchase price.

Gross rental yields drifted another notch lower in June due to dwelling values rising at a faster pace than weekly rents. Currently, the typical gross yield for a capital city house is recorded at 3.5%, which is equivalent to the record low last recorded in 2007. The average gross yield on a capital city unit also fell over the month to reach 4.4%; the lowest gross apartment yield since 2010 and not far off the all-time low of 4.3% recorded in 2007.

It looks likely that the pace of capital gains will remain higher than rental growth which will push rental yields even lower over the coming months. Melbourne continues to hold the unfortunate title of the lowest yielding capital city, but if current trends continue, it won’t be long before Sydney overtakes Melbourne due to the substantially higher rate of capital gain in the face of comparatively low rental appreciation.

Brisbane is now recording the highest gross rental yield for apartments, at 5.4%, and the only capital city where gross rental yields have improved over the year has been Hobart which is now starting to rival Darwin as the highest yielding capital city for houses.

It is difficult to imagine Sydney maintaining such a rapid pace of capital gains. Not only is affordability becoming a challenge for many sectors of the market, but yields are substantially compressed, rents are hardly moving and investors are facing tighter financing conditions from lenders. In the absence of a trigger event, such as a sharp rise in the jobless rate, higher interest rates or an external shock, it is unlikely we will experience a significant correction in dwelling values. However, the longer this run of growth continues across our largest capital cities, the more susceptible the housing market becomes to changes in the economy or broadly across household finance.

Source RP Data

Reducing Holiday House CGT

Keeping valid and accurate records from the time you purchase your holiday retreat can pay off when it comes to selling the property and calculating CGT.

Owners should not forget to take into account the capital gains that may arise when they eventually sell their holiday house.

Since only an individual’s family home or ‘main residence’ is exempt from capital gains tax (CGT), owning other property, such as a holiday house, will put CGT squarely on the table. But there is a way an individual can reduce their capital gain.

Where the property was bought after August 20 1991, and used only for private purposes, its cost base can be increased by including expenses, such as interest, rates and taxes.

Capital gains are calculated by subtracting (from the property’s sale price) the cost base plus certain eligible expenses that were incurred as a consequence of owning the property.

If the property is owned for at least 12 months, then 50% of the capital gain is added to the landlord’s taxable income for the year in which they sell the second property. This is taxed at the landlord’s marginal tax rate.

When making the CGT liability calculation, some common expenses that may qualify as part of the cost base of the holiday retreat include:

  • legal fees or stamp duty on the purchase
  • sales commissions and legal expenses
  • specific capital improvement costs
  • holding costs”, such as water or council rates
  • mortgage interest
  • repairs, maintenance, gardening and cleaning

Any property additions or improvements can be included in a property’s cost base, but it is always a good idea to seek professional advice regarding this. Owners need to keep in mind that they must keep accurate records throughout their time of ownership, as it is almost impossible to substantiate claims without proper records.

Those who have owned the holiday house since before September 20 1985 do not need to worry about CGT.

Superannuation Obligations: Employees vs Contractors

Employers must be able to differentiate between an employee or a contractor in order to meet their superannuation obligations.

While employees work as a part of a business, contractors provide services to a business through their own business. Employers that fail to acknowledge this difference risk being penalised.

Problems generally emerge when a worker is paid as a contractor for a number of years and they are found by the ATO to be an employee. This means they were eligible for superannuation guarantee and other employee rights and entitlements. More often than not, employees will not mention the incorrect treatment until they finish working for the employer.

There are different factors that can help with correctly classifying a worker (see table below).

Employers who make a classification error may get a monetary penalty for failing to meet PAYG withholding requirements and a super guarantee charge for making incorrect superannuation contributions.

They are also liable for backdated PAYG, superannuation guarantee payments and payroll tax.

Employers can refer to the legal definition to reduce the risk of paying penalties and charges. Section 12 of the Superannuation Guarantee (Administration) Act 1992 (SGAA) determines employees to be those who work under a contract that is wholly or principally for the labour of an employer. Whereas, a contractor is defined as a person who is paid to do work of a private nature for less than 30 hours per week.

Annual Leave Overhaul

The Full Bench of the Fair Work Commission reached a crucial verdict for employees covered by modern awards that will change annual leave entitlements.

The ruling will be inserted into all modern awards, giving employers important new rights and more flexible leave arrangements with their employees.

Annual leave overview

All full-time and part-time employees are entitled to four weeks of annual leave in a 12 month cycle. Accrued annual leave is based on their ordinary hours of work during the year. Because there is no minimum or maximum amount of annual leave that can be taken at a time, employees can hoard their leave entitlements.

Direction to take leave

Under the new rule, businesses with employees covered by modern awards can now direct their staff to take time off from work once they have accumulated eight weeks of leave. The decision provides welcome relief to employers who have long dealt with the detrimental effects of accrued annual leave.

Before making a direction, the employer and the employee must reach an agreement on how to reduce or eliminate excessive annual leave. In situations where both parties cannot find a suitable solution, an employer can give their employee a written direction to take leave.

The direction must be in writing, and meet the following requirements:

  • The direction must not leave the employee with less than six weeks of paid annual leave after the directed annual leave is taken.
  • The employee cannot be directed to take off a period of leave of less than one week.
  • The employee cannot be directed to take leave less than eight weeks, or more than one year after the date of the direction.
  • The direction cannot be contradictory to any leave arrangements already in place.

Cashing out of annual leave

A further ruling enables employees covered by modern awards to cash out a portion of their annual leave, rather than taking their leave. Employees who elect to receive cash instead of taking leave, should their employer agree, must satisfy the following conditions:

  • The cash-out agreement must be in writing and signed by both parties. The agreement must be retained by the employer.
  • The agreement must state the amount of leave to be cashed out, the payment to be made to the employee, and when it will be made.
  • Annual leave cannot be cashed out if it results in the employee’s remaining entitlement being less than four weeks.
  • Employees are not allowed to cash out more than two weeks of accrued annual leave in a 12 month period.

Quarterly Review October 2015

Share Market Review

The Australian share market has suffered its worst quarter in four years, with the ASX/200 closing at 5,021.60 points on 30th September 2015. The ASX/200 finished the previous quarter (30/06/2015) at 5,459 which equates to a drop of 437.4 points or 8.01%. It marks the worst quarter since the European debt crisis in 2011, when the share market fell 13%. The downfall has been led by the global themes of China and US interest rates.

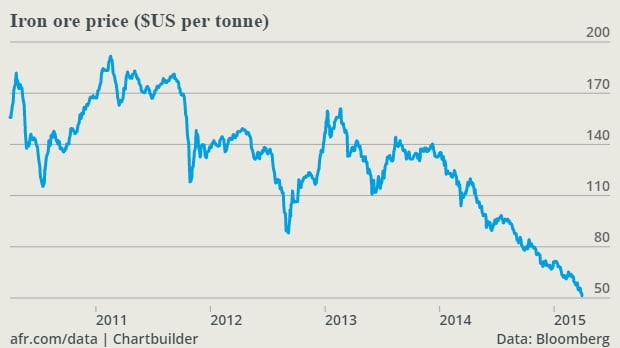
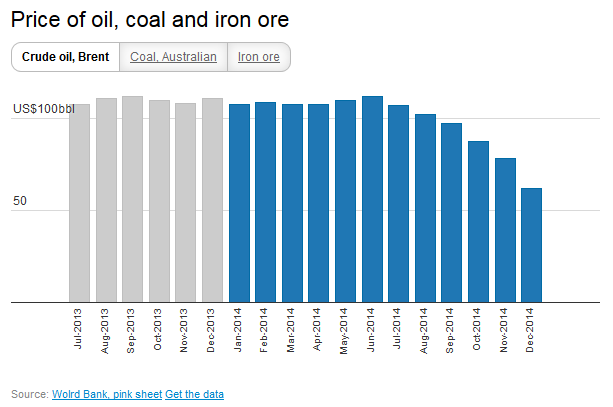
Fears of a steep economic slowdown in China hit resources stocks particularly hard, as global commodity prices fell. Energy was the local market’s worst performing sector in the third quarter, plunging 26%, followed by materials, down 12.8%. Financials dropped another 9.1%, extending a sell off that began in the second quarter.

Just two sectors posted gains over the three months: industrials rose 2.4%, buoyed by a sinking Australian dollar, while utilities gained 1.3%, as investors sought the refuge of comparatively safe earners.

The dismal three months to 30th September is shared by global peers, with both the S&P 500 and Dow Jones Industrial Average down more than 8%. London’s FTSE 100 was down 9% and the German DAX index also fell by 13%.

The main cause of negativity to global markets has been concerns over growth in China. The unpredictability of policymakers’ actions has created some concerns. This follows additional cuts to the country’s benchmark lending rate.

The second theme was the US Federal Reserve’s decision not to raise interest rates as was anticipated at its meeting in September. Federal Reserve Chair, Janet Yellen, indicated that the committee considered a rate increase in September, but it was judged appropriate to “wait for more evidence” to ensure the impact from recent global developments were not more pronounced than anticipated – essentially highlighting concerns about the global growth outlook. Interestingly, the Fed still continues to favour an interest rate hike this year.

Within our local market, changes have been occurring within the banking sector which has caused a negative impact to share prices. APRA has introduced a number of measures to increase the resilience of the banking system. These include: increasing mortgage risk weights, moving towards “unquestionably strong” capital ratios, enforcing minimum mortgage serviceability criteria and limiting investment property loan credit growth to 10% per annum. In addition to tightening underwriting criteria and raising equity, the banks have also repriced their investment property lending books and reclassified many mortgages.

Our outlook for equity markets is positive although we expect volatility will continue but believe this presents buying opportunities for investors. We believe a more severe correction would require a material downturn in earnings, which there is not enough evidence of at this stage.

Over the 2015 calendar year the market has traded just short of the 6,000 point mark and dipped just below the 5,000 point mark just recently. We note that the Australian share market closed at 5,021.60 points on 30th September 2015 and is still 26.94% below the market high on 1st November 2007 of 6,873.20, which is now almost eight years ago.

Economic Update

The Reserve Bank of Australia (RBA) has kept the cash rate steady at 2% over the last quarter.

RBA Governor Glenn Stevens stated after their most recent meeting “The global economy is expanding at a moderate pace, with some further softening in conditions in China and East Asia of late, but stronger US growth. Key commodity prices are much lower than a year ago, in part reflecting increased supply, including from Australia. Australia’s terms of trade are falling.”

We expect this low interest rate environment to remain the state of play for some time to come.

Employment growth has been surprisingly robust especially considering the economy has been growing at a pace below its trend. The current strength is not believed to be sustainable, with persistently weak revenue and profit growth meaning firms will be reluctant to take on more people, suggesting that employment growth will reduce over the next year or so.

The unemployment rate increased from 6% in May to 6.3% in July, but retreated back to 6.2% in August. This volatility is expected to persist over the coming months, with the unemployment rate expected to remain around 6.3% until mid-2016 at least. This is largely due to the loss of employment from the falling resources construction not being fully absorbed into the non-mining sector.

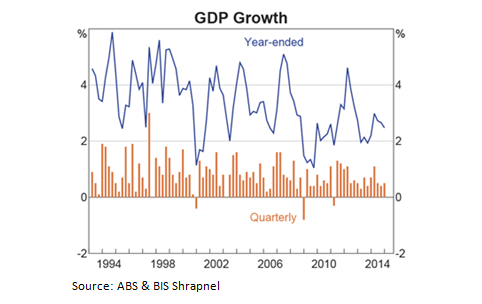
Australia’s real GDP grew by 0.2% in the June 2015 quarter (seasonally adjusted), bringing the through-the-year growth (June 2015 compared to June 2014) to 2.0%.

Real GDP growth is forecast at 2.6% for 2015/16. This is 0.6% lower than forecasted last quarter as some revision needed to be made to individual expenditure forecasts, particularly:

• Plant and equipment investment is expected to decline by 6.6% as opposed to -4.8% forecasted last quarter. The latest forecast takes into account a more pessimistic outlook by the ‘other’ (mainly service) industries although we think the pessimism may be slightly overcooked.

• Imports have been revised down in line with expected lower plant and equipment expenditure, largely offsetting the negative contribution from equipment investment.

Notwithstanding the aberration last quarter, we believe dwellings investment, which has been a key driver of growth over the past two years, has another year of growth before running out of steam. New dwellings will continue to drive this growth but it is being joined by strong alterations and additions activity.

The mining investment boom is now ancient history. This financial year will be the second year of an expected four year decline in resources construction. The trough in 2017/18 is estimated to be 60% lower than the peak of $60 billion reached in 2014/15 (in constant prices). Consequently, mining construction will make negative contributions to growth for the next three years, at least.

The decline in mining investment will swamp modest increases in private non-dwelling building and the recovery in intellectual property products, keeping overall business investment lower, on average, over the next two years.

Private non-dwelling building is likely to experience solid growth over the next two years. A healthy pipeline of projects in the office, retail accommodation, warehouse, aged care and entertainment and recreation segments will push overall building higher this year (+2.2%) and in 2016/17 (+1.9%).

The Australian dollar has come under pressure over the last few months. It has fallen over 12% from a recent peak in May against the US dollar, and on the 7th September, the AUD hit a six-year low of US$0.6896. The Australian dollar is buying around US$0.73 at present after a recent rally. Monthly forecasts for the remainder of 2015 are relatively flat with the dollar expected to fall to around US$0.70 by year end.

There has been a bit of talk of a recession from some in the industry given the soft June quarter outcome. Australia won’t have a recession as the underlying fundamentals for ongoing growth remain in place. We expect exports to rebound strongly and make a significant positive contribution to growth this year. We believe dwellings building, a key driver of growth over the past two years, has another year of growth particularly from the alterations and additions segment before it runs out of puff. Consumer demand is robust and will build momentum over the next two years supported by relatively low interest rates and improved wealth effects from recent house price gains across most capital cities. In addition, a significant pent up demand for non-mining business investment exists.

Nonetheless, growth will be soft this year before recovering strongly next year.

Property Market Update

As subscribers to CoreLogic RP Data research we outline below an article by Cameron Kusher on what’s happening in the Sydney Housing market:

What is going on in the Sydney housing market?

There’s been a number of articles over the last few months about the peak of the Sydney market. It does look as if the market is at or slightly past its peak however, it is important to thoroughly investigate how the market is tracking currently.

Values

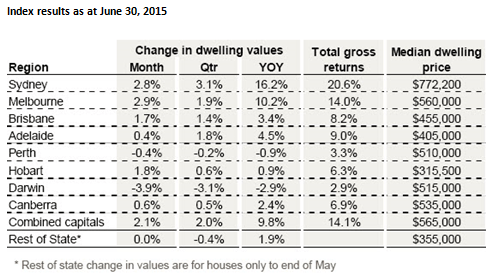
Sydney home values have increased by 17.6% over the 12 months to August 2015 and by 14.0% over the first 8 months of 2015. Sydney home values have been trending higher since they reached a low point in May 2012 and since that time Sydney home values have increased by a total of 49.5%. To put that growth in perspective, a home worth $500,000 in May 2012 would now be worth $747,704. The data presented shows that home values have been trending higher at a fairly rapid pace however more recent data may point to a slowing of the rate of growth. Home values rose by 1.1% over the month of August however, data for September is showing a much more sluggish rate of growth in home values with values -0.3% lower over the twenty eight days to 20th September.

Sales transactions

Unfortunately sales transactions are not a timely indicator of the market’s performance due to delays in receiving the full population of settled sales transactions. Furthermore, off-the-plan sales are entered into sales counts at their contract date however the record is not received until settlement which could be several years down the track for large projects. As a result, when you have heightened off-the-plan sales activity as we currently do, unit sales in particular are inclined to be undercounted. The latest sales data to June 2015 shows that over the second quarter of the year there were 23,432 sales. Compared to the same quarter in 2014, the volume of house sales were -5.5% lower and unit sales were -16.5% lower.

Time on market

At the end of July 2015 the typical Sydney home was selling after just 25 days. CoreLogic RP Data has been tracking the time on market since the beginning of 2005 and this is the quickest rate of sale recorded over this period. The combination of strong value growth and a rapid rate of sale suggests that demand is still quite strong across the city.

Auction clearance rates

The preliminary auction clearance rate for Sydney last week was 73.2% which was virtually unchanged from the final auction clearance rate the previous week. Importantly, in most instances the final auction clearance rates are revised lower. Auction clearance rates have shifted from their peak of almost 90% in April of this year to their current level. At the same time a year ago clearance rates were recorded at a higher 78%. It is important to note that over recent weeks the number of properties being taken to auction has been significantly higher than the number taken to auction a year ago. Nevertheless it is clear that the auction market which represents slightly more than a quarter of all Sydney home sales has weakened over recent months and has not rebounded so far during the Spring Selling Season.

Property listings

The latest weekly listings data which tracks houses, units and vacant land for sale across Sydney shows that over the past 4 weeks there were 8,525 new listings and 20,121 total listings. New listings are now at their highest level since the week ended 30th November 2014 and total listings are at their highest level since the week ended 14th December 2014. Comparing listings to levels at the same time a year ago shows that new listings are currently 19.0% higher and total listings are up 5.0%. In the early part of the Spring Selling Season there is much more stock available for sale in Sydney than there was at the same time a year ago. Heightened stock levels at a time when auction markets are softening and value growth has shown some early signs of slowing may contribute to a further slowdown in the rate of capital gain over the coming months. This is due to the fact that active buyers are afforded more choice and may not have to pay such a price premium to secure a home.

Mortgage Activity

The CoreLogic RP Data Mortgage Index tracks pre-purchasing activity and has shown some clear weakness over recent weeks. While the Index remains at quite high levels it has fallen by -2.0% over the past couple of weeks at a time when, seasonally, the trend should typically be rising. At the same time last year the index had risen by 1.2% over the previous two weeks. With mortgages, particularly investment mortgages becoming more difficult to obtain, we are potentially seeing the first signs that this segment of the market is starting to slow resulting in an easing of demand.

Building approvals

The latest building approvals data for July 2015 shows that there was a record high 5,159 dwelling approvals over the month. This was comprised of 1,655 house approvals and 3,504 unit approvals. Over the 12 months to July 2015 there have been 15,213 house approvals and a record high 30,921 unit approvals. Sydney has consistently approved more units for construction than houses since early 1993. With a record pipeline of new housing stock it is going some way to alleviating housing shortages across the city. It also affords buyers much more choice when they are looking to purchase a new home

Housing finance

The latest housing finance data for New South Wales to July 2015 shows that demand from the owner occupier segment is starting to ramp-up while investor demand is starting to wane. Importantly, owner occupier demand includes refinances so if we look exclusively at new lending (excluding refinances) we also see owner occupier demand ramping up while investor demand seems to be waning. Investors still account for the greatest proportion of new lending (58.0%) however, two months ago investors accounted for a record-high 62.4% of all new mortgage lending in NSW.

Rents and yields

Over the 12 months to August 2015, rental rates across Sydney have increased by 2.3% which is the slowest annual rate of rental growth since May 2013. With rental growth sluggish and value growth remaining very strong, gross rental yields across Sydney have shifted to record low levels. Yields were recorded at 3.3% in August 2015 which is the softest yields on record. We’ve already mentioned that investor activity across NSW has recently hit record highs and remains elevated. It appears that many investors are having little regard for rental returns and are largely focussing on the future capital growth potential and the subsequent benefits from a negative gearing strategy.

Although the data is still generally undoubtedly strong, it appears there are signs that the market could be showing the first sign that growth rates are peaking. Record high new housing supply at a time when mortgage demand is seemingly slowing along with auction clearance rates and listings are rising points to potentially softer value growth conditions for the city. While we expect the rate of growth will likely start to slow, the significant stimulus of low mortgage rates is expected to ensure that home values continue to rise albeit at a more moderate pace.

Source RP Data

Quarterly Review January 2015

Market Update

The final quarter for the 2014 calendar year was volatile but positive with the ASX/200 closing at 5,411 on 31 December 2014. The ASX/200 finished the previous quarter (30/09/2014) at 5,292.80 which is a gain of 118.20 points or 2.23%.

The quarter kicked off strongly with October up 233.80 points or 4.42%, November wiped October’s gains off losing 213.60 points or 4.02% and then December finished the quarter up 98 points or 1.84%.

For the calendar year of 2014 the ASX/200 increased from 5,352.20 to 5,411 an increase of 58.80 points or 1.10%. We point out that the market is still trading 21% lower than the high from 1st November 2007 of 6,873.20.

High yielding sectors were the best performers of 2014 with A-REITs (listed property trusts) up 27%, telecommunications 21% and healthcare 24%. The banking sector still provided a strong yield however share price growth was impacted by regulatory concerns around the recommendations of the Financial Services Inquiry.

Energy and material sectors were the worst performers due to falling commodity prices.

Between July 2014 and January 2015 the price of oil plunged over 55%. One of the steepest legs of this decline was a 10% drop that occurred on Black Friday November the 28th following a meeting of OPEC. The reason for this fall was that the Saudis had refused to agree to production decreases being pushed by some OPEC members, instead choosing to let the market play out for the time being.

Over the 2014 calendar year the Australian dollar also dropped losing 8.2% and falling from US$89.15 on 1stJanuary 2014 to close the year at US$81.84 on 31st December 2014. December saw our dollar reach a 4 year low against the US Dollar. While the drop in our dollar isn’t good for people travelling overseas it is good for some Australian companies and the Reserve Bank of Australia has publically stated that it would like to see the Australian dollar weaker still. A lower Australian dollar would improve the competitiveness of Australian manufacturers and should provide a boost to the tourism market from international travellers.

Australian company balance sheets are generally in a good position. Most companies are able to comfortably service debt obligations and for some borrowing costs are falling as debt facilities are renewed. Several companies have also indicated they intend to increase their dividend payments (Telstra) and some (such as Wesfarmers) are returning capital to investors. We expect that the market will continue to generate a dividend yield above 4% for investors. This return is appealing compared to the dividend yield of other major international equity markets and could see Australian shares continue to be supported by offshore investors. It’s also attractive when compared to our term deposit and cash rates.

Economic Update

Over the last quarter of 2014 the cash rate remained steady at 2.5%. The Reserve Bank of Australia reported that growth in our economy was growing at a moderate pace and inflation was, as expected, stable at around 2% to 3%.

Economists expect that interest rates may well decline further in 2015 or at the very least remain where they are for an extended period.

Australia’s GDP rose only 0.3% which is consistent with expectations, albeit not exciting. GDP growth for 2015 is forecast to be in the region of 2.7% to 3.5%. Higher than usual levels of uncertainty in economic outlook, as well as the need for a significant lift in the non-mining segment of the economy, are the driving factors of such a broad range.

Unemployment was one of the only things that was up in 2014. The unemployment rate is forecast to hover around 6.1 – 6.2% over the coming 12 months.

Housing investment was also up right throughout 2014. Further growth in this area is expected going into 2015 with economists predicting an increase of around 7.5% for the year. Low interest rates, robust population growth and underlying pent-up demand as well as a shortage of supply are all drivers here.

Oil and commodity prices took a beating over the last quarter of 2014 with oil declining around 55% over the last 18 months. The US dollar strengthened over the quarter and our dollar fell to US$0.82 by the end of December. The RBA reported that our dollar “remains above most estimates of its fundamental value, particularly given the significant declines in key commodity prices in recent months. A lower exchange rate is likely to be needed to achieve balanced growth in the economy.”

A slump in the oil price is not all bad news for the average Aussie however, if you drive a vehicle you will have noticed it costs a lot less to get around at present.

We are still very much in an era of change (post-GFC and the mining boom) and we anticipate that we will need to continue to ride the volatility wave across all sectors of economy for some time yet.

On the upside, the Australian share market is forecast to rally to around 6,000 points by 2015 year-end.

The below chart illustrates the quick decline of our major exports in the last quarter of 2014:

Property Market Update

The December 2014 results of the CoreLogic RP Data Home Value Index saw combined capital city home values rise by 0.9% over the month to take the annual increase to 7.9%.

The CoreLogic RP Data Home Value Index showed that dwelling values across the combined capital cities increased by 0.9% in December 2014. Throughout the month home values rose in all cities except for Darwin (-0.6%) and Canberra (-0.6%) while values were unchanged in Sydney.

Over the final quarter of 2014, capital city home values increased by 1.6%, with Perth (+2.8%), Sydney (+2.3%) and Brisbane (+1.8%) recording the greatest quarterly gains, while values fell in Darwin (-1.7%) and Canberra (-3.4%). Despite the positive result across most cities, the annual rate of capital gain across Australia’s capital city housing market has continued to slow.

The capital gain on houses compared to units was higher, with house values gaining 8.4% over the calendar year compared with a 5.1% increase in unit values. According to CoreLogic RP Data research analyst Cameron Kusher, detached housing remains in high demand despite the higher price point. He said we haven’t seen the same ramp up in building approvals for detached housing compared with multi unit dwelling approvals.

“Based on the median price across the combined capital cities, houses are attracting a $100,000 premium over apartments.”

“The slowing annual growth rate is further evidence that the housing market is losing some steam with combined capital city home values increasing by 9.8% over the 2013 calendar year compared to a more moderate 7.9% increase in 2014.”

Based on the December results, the annual rate of capital growth has continued its moderation which has been ongoing since April 2014.

After the annual rate of combined capital city home value growth peaked at 11.5% over the 12 months to April 2014, the rate has now slowed to 7.9% in December 2014. Combined capital city home values have increased at their slowest annual pace since October 2013.

Although home value growth has been recorded at 7.9% throughout the 2014 calendar year, the rate of growth has varied between a fall of -0.6% in Canberra to an increase of 12.4% in Sydney. While Canberra was the only city to record an annual fall in home values, Melbourne was the only city other than Sydney to have recorded annual value growth of more than 5.0% (7.6%).

Auction clearance rates reduced noticeably across the two largest auction markets, Sydney and Melbourne, over the final two months of the year. While clearance rates were typically recorded at around the high 70% and mid 70% mark respectively, at the start of Spring, clearance rates in December were around the mid to high 60% mark in both Sydney and Melbourne.

While dwelling values are generally still rising, rental growth is sitting at its lowest annual rate in more than a decade, with combined capital city rents increasing by just 1.8% over the past 12 months. House rents have increased by 1.7% over the past year compared with a 2.4% for units. With value growth outpacing rental growth, yields continue to shift lower. Twelve months ago gross rental yields across the combined capitals were recorded at 3.9% for houses and 4.6% for units. As at December 2014, gross rental yields were recorded at 3.7% for houses and 4.5% for units.

According to Mr Kusher, CoreLogic RP Data expects dwelling values will continue to appreciate in 2015, at least across the combined capital cities. However, the rate of capital gain is likely to continue to slow over the coming months.

“Affordability hurdles in Sydney, and to a lesser extent in Melbourne, are making it increasingly difficult for some buyers to enter the market. Additionally, low rental yields and the likelihood of tougher lending criteria to investment buyers will likely dampen the very active investor segment of the market which may in turn reduce housing demand in 2015.”

“Furthermore, with so much investment activity increasing the stock of rental housing as well as the surge in dwelling approvals, we would expect that rental growth will remain sluggish across the capital cities. As a result we anticipate a further compression of gross rental yields in 2015,” Mr Kusher said.

Source RP Data

Business Brief March 2015

Excellence Isn’t Enough

A car is a car, but a BMW is a driving machine. There is the iPad, and then there are products generically called ‘tablets’. And why the premium on bags with the easily recognisable Gucci logo? Sameness we forget. Distinctiveness we remember, pay more for and tell others about. Success isn’t about being excellent, good or even great. It’s about being distinctive.

Excellence used to be the goal of every successful business. Today it isn’t enough and here’s why:

1. Excellence is relatively easy to accomplish – A good copycat watches what the industry leader is doing and then does the same things. If you’re only excellent, you’re vulnerable.

2. Excellence is a moving target – Today’s ‘excellent’ can be next month’s ‘mediocre’. In a competitive market, the trend is always towards better, so excellence can never be something you attain with finality.

3. The more excellent you become, the more demanding your customers become – A customer’s expectations increase over time based on previous experience. Getting better drives customer expectations up.

In essence, the biggest problem with excellence is that it isn’t distinctive. The killer marketplace strategy is to be distinctive: to go beyond excellent to offer something distinct and unique to your company. That way if customers ever go someplace different, they’ll miss the distinction you represent and return.

So what are the marks of distinction?

There are several things common to all companies who achieve distinction. They are: engaged people, involved customers, perpetual innovation and strategic execution.

Engaged people

Engagement is about focus, passion, attention and intention. Engaged employees are involved with their work and are compelled to do it with panache. The challenge is to get people as engaged about their work as they are about their outside interests and hobbies. Engaged people work smarter, serve better and come up with new ideas.

Involved customers

To have fans, you need involved customers. Involvement creates ownership and passion.

Involved customers give feedback – And you listen

They make suggestions – And you take note

They ask questions – And you answer

They tell others – And you enter into the conversation

Today, the old adage might no longer be true: no news may not be good news. No news from those who buy and use your products probably means they aren’t involved.

Perpetual innovation

This includes both incremental and revolutionary improvements. The status quo is a myth. You’re either getting better or you’re getting worse. Innovation must be applied to everything: operations, products and even how we think and lead.

Strategic execution

Business dominance isn’t about how much you know, but how well you apply and execute what you know. It’s a matter of IQ. That doesn’t stand for ‘intelligence quotient’ but rather ‘implementation quotient’, and that is the difference between common knowledge and consistent application.

The future will be anything but boring. As business leaders, you will have plenty of challenges. Just make sure you get serious about pursuing and developing distinction.

Author Credits

Mark Sanborn CSP CPAE is an acclaimed speaker, bestselling author and president of Sanborn & Associates Inc., an idea studio for leadership development. For more information, visit www.MarkSanborn.com

[Quote]

“The most difficult thing is the decision to act, the rest is merely tenacity.”

AMELIA EARHART

FBT Shake Up In 2015

The new FBT year starts on 1 April 2015. Here’s what you need to know.

Keeping on top of your Fringe Benefits Tax (FBT) obligations this year will be a little more onerous with a temporary increase in the FBT rate from 47% to 49% on 1 April 2015. The FBT rate will then stay at 49% until 31 March 2017.

The change in the FBT rate for the next 2 years has a number of implications particularly to those employers with salary sacrifice agreements in place or where fringe benefits form part of your employment agreements.

FBT gross up rates have also changed in line with the rate change. The new rates are:

FBT yearFBT rateType 1 gross up rateType 2 gross up rate
1 April 2014 to 31 March 201547%2.08021.8868
1 April 2015 to 31 March 201749%2.14631.9608
1 April 2017 onwards47%2.08021.8868

The FBT rate change is a by-product of the introduction of the 2% Debt Tax (Temporary Budget Repair Levy) on high income earners. The debt tax is payable at a rate of 2% on every dollar of a taxpayer’s annual taxable income over $180,000. In effect, the top marginal tax rate became 49% from 1 July 2014. The change to the FBT rate is to discourage high income earners from using the FBT system to lower their taxable income.

If your executives and high-income earners have not put in place any arrangements to manage the debt tax, there are still some planning opportunities available.

Review all salary sacrifice agreements

It’s essential that you review all salary sacrifice agreements. Providing employee benefits is more expensive and potentially less attractive now and over the next few years unless that cost is passed through to employees. And, in some cases, the salary sacrifice agreement may not achieve the intended goals and simply create an administrative burden for little to no benefit.

FBT change and not-for-profit entities

For employees of charities, not-for-profit organisations and certain other entities, the exemption threshold from FBT will increase to ensure that the total value of cash benefits received by these employees are not affected.

This will mean that:

  • For public benevolent institutions and health promotion charities the exemption from FBT for benefits will increase to a grossed-up annual cap of $31,177 per employee (currently $30,000) from 1 April 2015.
  • For public and not-for-profit hospitals and public ambulance services the exemption from FBT for benefits will increase to a grossed-up annual cap of $17,667 per employee (currently $17,000) from 1 April 2015.

Changes to FBT planning opportunities – It seems that as soon as someone promotes a new way to utilise the FBT system for planning purposes or a significant number of taxpayers start using a planning method, the Government or the ATO closes that opportunity. This is the case with:

Living away from home allowances – reforms from 22 October 2012 severely limit access to FBT concessions for living away from home (LAFH) allowances particularly for non-residents. The reforms introduce a higher level of substantiation, limit the time the FBT concessions can apply to a LAFH to 12 months (in most cases), and dictate strict conditions such as maintaining a home in Australia for their personal use (no rentals). Special rules exist for fly-in-fly-out and drive-in-drive-out employees.

Salary sacrificing goods or services that your business provides – for many businesses, there was once a tangible financial benefit to packaging up goods or services they provide as part of the remuneration offered to employees. Retailers providing discounted clothes to employees and private schools discounting school fees for children of employees, are just two examples. On 22 October 2012, the FBT concessions that were previously available in this situation were removed.

ATO targets

Travelling or living away from home – what’s the difference?

Another issue that comes up is determining whether someone is living away from home, relocating or just travelling. The ATO is looking closely at Australian taxpayers claiming living away from home (LAFH) allowances to make sure they are not incorrectly accessing the FBT concessions. If somebody is living in Sydney but travelling to Melbourne on an ad hoc basis every other week for work, they are simply travelling. They may be entitled to travel deductions but are not entitled to the FBT concessions that can apply to LAFHAs. If the person relocates temporarily to Melbourne, keeps their home in Sydney for their use (can’t be rented out), then it’s more likely they can access the living away from home allowance concessions. You need to double check to get the distinctions right.

Motor vehicles

Where a motor vehicle owned or leased by the business is used by an employee for private purposes (including travelling between home and the workplace), then FBT is an issue that needs to be managed.

Interaction between FBT, income tax and GST

If you pay FBT on a benefit relating to entertainment then the business can generally claim a deduction for the costs associated with providing the entertainment as well as the GST credits. However, if FBT does not apply to the benefit then no deduction or GST credits can generally be claimed.

Entertainment can be almost anything from food, drink, recreation such as movie tickets, to non-work based travel. If you provide any entertainment benefits to employees, such as an employee attending a business lunch, then FBT might apply.

Structuring employee salaries through a unit trust

The ATO has warned employers against complex structuring arrangements designed to channel benefits to employees using an employee remuneration trust. The most recent ATO alert looks at arrangements where the employer repays an employee’s loan through a trust. Under these arrangements, employees acquire units in a unit trust funded by a loan from the trustee. The loan is repaid by the employer using amounts salary sacrificed by employees. The result is that the taxable value of the benefit provided to the employee skirts the FBT system – a big no, no from the ATO’s point of view.

How do I know if I need to pay FBT?

If you are not sure whether you are providing fringe benefits to your employees, here are some key questions you should ask yourself:

  • Do you make vehicles owned or leased by the business available to employees for private use?
  • Does your business provide loans at reduced interest rates to employees?
  • Has your business forgiven any debts owed by employees?
  • Has your business paid for, or reimbursed, any private expenses incurred by employees?
  • Does your business provide a house or unit of accommodation to employees?
  • Does your business provide employees with living-away-from-home allowances?
  • Does your business provide entertainment by way of food, drink or recreation to employees?
  • Do any employees have a salary package (salary sacrifice) arrangement in place?
  • Has your business provided employees with goods at a lower price than they are normally sold to the public?

What is exempt from FBT?

Certain benefits are excluded from the scope of the FBT rules. The following work related items are exempt from FBT if they are provided primarily for use in the employee’s employment:

  • Portable electronic devices (e.g. laptop, tablet, mobile, PDA, electronic diary, notebook computer, GPS navigation device) that are provided primarily for use in the employee’s employment (limited to the purchase or reimbursement of one portable electronic device for each employee per FBT year);
  • An item of computer software;
  • Protective clothing required for the employee’s job;
  • A briefcase;
  • A calculator;
  • A tool of trade.

$200 Million Boost For Pensioners

Published 16 February 2015 on the Minister for Social Services’ website: www.scottmorrison.dss.gov.au

More than 770,000 Australian part-pensioners and allowance recipients will be given a $200 million boost to their payments with the lowering of the social security deeming rates from 20 March, Minister for Social Services, the Hon. Scott Morrison said today.

“This additional investment will mean more in the pockets of pensioners. Under the new deeming rates part-pensioners will receive an average increase in their payments of $3.20 a fortnight, $83.20 a year,” Minister Morrison said.

“This will be in addition to the indexation increase in the pension also coming into effect on 20 March.

“The lower deeming rate will decrease from 2 per cent to 1.75 per cent for financial investments up to $48,000 for single pensioners and allowees, $79,600 for pensioner couples and $39,800 for each member of an allowee couple.

“The upper deeming rate will decrease from 3.5 per cent to 3.25 per cent for balances over these amounts.

“These payments show that the Coalition understands the pressures facing pensioners and that we have a plan to support pensioners deal with rising costs of living and changing economic circumstances.

“The change to deeming rates follows the fall in petrol prices that is also taking some pressure off, as is the abolition of the carbon tax that led to an immediate fall in power prices.

“Bill Shorten has no plan to support pensioners deal with cost of living pressures, he only has a plan to scare pensioners, falsely claiming that pensions are not increasing. Dispensing unfunded empathy is no substitute for Bill Shorten and Labor being a policy free zone.

“The current generation of aged pensioners had a deal with the Government over their lifetime that if they worked hard there would be an aged pension at the other end. This Government is keeping that deal and seeking to make the aged pension sustainable for future generations who will need it.

“The deeming rules are a central part of the social security income test and are used to assess income from financial investments for social security and Veterans’ Affairs pension and allowances.

“The deeming rates have been further reduced as returns available to pensioners and other allowees have decreased.

“Deeming rates reflect the rates of return that people receiving income support payments can earn from their financial investments.

“If income support recipients earn more than these rates, the extra income is not assessed.

“Payments affected by the deeming rates include income tested payments such as the Age Pension, Disability Support Pension and Carer Payment, income support allowances and supplements such as the Parenting Payment and Newstart,” Minister Morrison said.

7 Things You Need To Know About Self Managed Super Funds

1. What is a self-managed super fund?

A self-managed super fund (SMSF) is a superannuation fund with a maximum of four members who act as the fund’s trustees and direct its investment strategy, giving Australians the chance to take a more active role in planning their retirement.

SMSFs represent the fastest growing sector of the superannuation industry, representing 99% of all super funds and controlling 33% of the $1.6 trillion invested in super. Australia now has more than half a million SMSFs, with the average SMSF balance being over a million dollars.

2. The advantages of a self-managed superannuation fund

For most Australians, superannuation is one of their most important assets, usually only coming second to the family home. Superannuation is a great way to plan for your retirement, offering you a lot of tax breaks and ensuring that you are putting money aside for the future you want.

However, it can be unsettling when you do not know exactly where and how this crucial asset is being invested. It is natural to want to have more control over your super, and to understand exactly where your money is invested.

Unfortunately, many industry, retail and corporate funds can be very vague in letting you know where your money is, for example simply saying ‘Australian shares’. Additionally, the choice of risk categories offered to members are often not specific enough to fully reflect your individual investment needs.

Starting an SMSF is not just about choice, but also control. You can create a more sophisticated investment strategy that is perfectly aligned with your risk appetite, ensuring that your money is doing precisely what you want it to do.

Recently, it has become possible for SMSFs to borrow money in order to purchase property. This means that when members reach pension age, they will be able to take control of the property, something that is not possible in other types of funds.

SMSF members also have a greater degree of control over the tax liabilities of their superannuation, and there are many effective tax minimisation strategies available to SMSFs.

There are also some advantages that are specific to business owners. Under some specific circumstances, your SMSF can even purchase your business premises, and the business can, in turn, lease the property from the SMSF.

3. The responsibilities of being an SMSF trustee

In the world of SMSFs, as with many things in life, increased freedom comes with additional responsibilities. As an SMSF trustee, you will be liable for all of the activities of the SMSF. This might sound daunting to some, but with the support of professional advice the risk of breaching compliance is significantly reduced.

The most important thing is ensuring that the activities of your SMSF meet the sole purpose test. This means that the only motive behind the fund’s investment strategy can be to provide for its members retirement. Every year you will need to lodge certain documents, and you will need to appoint an independent auditor to do at least some of this.

While it is not a legal requirement, a trustee should aim to have a certain degree of knowledge about the current financial and economic environment, to help you better understand your investment strategy. Of course, you can always seek professional advice in this area.

4. Investment options

An SMSF can invest in almost anything, provided that it does not compromise the sole-purpose test and is aligned with the fund’s investment strategy. One thing that your SMSF cannot do is invest in anything that may provide direct financial benefits to its members, or any related parties, such as family members. Australian shares, property and cash assets, such as term deposits, are the most popular assets classes for SMSFs, constituting approximately two-thirds of all SMSF assets.

In some circumstances, it may even be possible for SMSFs to invest in less-traditional assets, such as art, sports teams or racehorse syndicates (although such investments are subject to strict compliance requirements).

5. Determining your investment strategy

The ability to set your own investment strategy is one of the biggest draws of starting an SMSF. The first decision you should make is what level of risk you want to take on. Usually this decision will be influenced by how close the members are to retirement age.

You should also aim to have a degree of diversity across your asset portfolio, to protect the fund from any severe fluctuations. You also need to consider your liquidity; that is how fast the fund’s assets can be turned into cash.

The extent to which you and the other members of your SMSF, are planning to rely upon superannuation to provide for your retirement is also key to your investment strategy.

For example, if your personal assets are significant you may feel comfortable taking on a higher degree of risk when investing your superannuation.

6. How much do you need to start an SMSF?

The amount of super that you need to start an SMSF is entirely dependent upon your specific circumstances, and the reasons you have for wanting to take a more active role in managing your retirement.

As a general rule, it is advisable to have enough super to make the annual administration costs of running an SMSF proportionately equivalent to what you would be paying in a retail or industry fund (around 1-1.5%). However, there is a lot of variability within SMSF administration costs, and for some individuals paying a higher rate of fees may be a worthwhile trade-off. For example, if you currently have a low super balance but your income has increased, then it might be in your interests to start an SMSF now, with the knowledge that your balance will increase rapidly.

7. Choosing the other members of your SMSF

It is possible for you to be the sole member of your SMSF. However, if you pursue this path then you will need to have another individual or a legal entity sign on as a second trustee. Four is the maximum number of members that an SMSF can have, however, the majority of funds have two members. The advantage of having more members is that your administration costs will be reduced proportionately.

It is common for married couples or de facto partners to start an SMSF. The advantage of this is that you will likely have similar goals for your retirement, making the development of an investment strategy much simpler. Many people also form SMSFs with other family members.

However, you can start a fund with almost anyone (but not someone who is your employee). There are also restrictions on people who have been convicted of certain offences, or are in particular financial circumstances (for example an undischarged bankrupt).

Getting Your Business Insurance Right

Business insurance can be a tricky area to navigate.

Being under-insured can spell the death of a small business, but, on the other hand, it is all too easy to end up paying insurance premiums that are too high. This can place a significant drain on your business’s valuable resources.

Some common types of insurance that small business owners should consider include:

Workers’ compensation

All businesses with employees must take out workers’ compensation insurance to cover the costs of any injuries or illness incurred in the workplace.

If you do not have employees but regularly hire contractors, you should double check that they should not be classified as employees as this may land you in a serious position in the event of an injury.

Comprehensive car insurance

If your business owns a motor vehicle you must have third party injury insurance, which is typically included in your vehicle registration. Depending on your financial position and the frequency with which you use your vehicle, it may also be highly advisable for your business to take out comprehensive vehicle insurance.

Public liability insurance

It is highly advisable for businesses to have public liability insurance, especially if they have a premises that is frequented by customers and/or clients. Public liability insurance protects you against personal injury and property damage claims that occur on your premises due to negligence.

Professional indemnity insurance

For many industries, professional indemnity insurance may be a wise investment. It protects your business against negligence claims made by clients. It will cover the legal costs of defending any claims and help in paying out any damages owing.

Product liability insurance

Any business that provides products directly to consumers should consider taking out product liability insurance. It will protect you against any financial damages or injuries caused by your products.

Level One Financial Advisers Pty Ltd. AFSL 280061. The information contained on this website is general information only. You agree that your access to, and use of, this site is subject to these terms and all applicable laws, and is at your own risk. This site and its contents are provided to you on an “as is” basis, the site may contain errors, faults and inaccuracies and may not be complete and current. It does not constitute personal financial or taxation advice. When making an investment decision you need to consider whether this information is appropriate to your financial situation, objectives and needs. Liability limited by a scheme approved under Professional Standards Legislation. Disclaimer and Privacy Policy

Doug Tarrant

Doug Tarrant

Principal B Com (NSW) CA CFP SSA AEPS

About Doug

As founder of the firm Doug has over 30 years of experience advising families, businesses and professionals with commercially driven business, taxation and financial advice.

Doug’s advice covers a wide variety of areas including wealth creation, business growth strategies, taxation, superannuation, property investment and estate planning as well as asset protection.

Doug’s clients span a whole range of industries including Investors; Property and Construction; Medical; Retail and Hospitality; IT and Tourism; Engineering and Contracting.

Doug’s qualifications include:

  • Bachelor of Commerce (Accounting) UNSW
  • Fellow of the Institute of Chartered Accountants
  • Certified Financial Planner
  • Self Managed Superannuation Fund Specialist Adviser (SPAA)
  • Self Managed Superannuation Fund Auditor
  • Accredited Estate Planning Specialist
  • AFSL Licensee
  • Registered Tax Agent
Christine Lapkiw

Christine Lapkiw

Senior Associate B Com (Accounting) M Com (Finance) CA

About Christine

Christine has over 25 years of extensive experience advising clients principally on taxation and superannuation related matters and was a founder of the firm when it began in 2004.

Christine’s breadth and depth of knowledge and experience provides clients with the comfort that their affairs are in good hands.

Christine currently heads up the firm’s SMSF division and oversees a team that provide tailored solutions for clients and trustees on all aspect of superannuation including:

  • Establishment of SMSFs
  • Compliance services
  • Property acquisitions
  • Pension structuring
  • SMSF ATO administration and dispute services

Christine’s qualifications include:

  • Bachelor of Commerce (Accounting)
  • Member of the Institute of Chartered Accountants
  • Master of Commerce (Finance)
Michelle Jolliffe

Michelle Jolliffe

Associate - Business Services B Com (Accounting) CA

About Michelle

Michelle has been with the firm in excess of 13 years and is an Associate in our Business Services Division.

Michelle and her team provide taxation and business advice to a wide variety of clients. Technically strong Michelle can assist with all matters in relation to taxation covering Income and Capital Gains Tax; Land Tax; GST; Payroll Tax and FBT.

Michelle is an innovative thinker and problem solver and always brings an in-depth and informed view to the discussion when advising clients.

Michelle has considerable experience with business acquisitions and sales as well as business restructuring.

Michelle’s qualifications include:

  • Bachelor of Commerce (Accounting)
  • Member of the Institute of Chartered Accountants
Joanne Douglas

Joanne Douglas

Certified Financial Planner and Representative CFP SSA Dip FP

About Joanne

Joanne commenced with Level One in 2004 and has developed into one of our Senior Financial Advisers.

With over 20 years of experience, Joanne and her team provide advice across a wide variety of areas including: Superannuation; Retirement Planning; Centrelink; Aged Care; Portfolio Management and Estate Planning.

A real people person Joanne builds strong long term relationships with her clients by gaining an in-depth knowledge of their personal goals and aspirations while providing tailored financial solutions to meet those needs.

Joanne’s qualifications include:

  • Certified Financial Planner (CFP)
  • Self Managed Superannuation Firm Specialist Adviser
  • Diploma of Financial Planning

Disclaimer & Privacy Policy

Disclaimer

The information contained on this web site is general information only. You agree that your access to, and use of, this site is subject to these terms and all applicable laws, and is at your own risk. This site and its contents are provided to you on “as is” basis, the site may contain errors, faults and inaccuracies and may not be complete and current.

It does not constitute personal financial or taxation advice. When making an investment decision you need to consider whether this information is appropriate to your financial situation, objectives and needs.

Level One makes no representations or warranties of any kind, expressed or implied, as to the operation of this site or the information, content, materials or products included on this site, except as otherwise provided under applicable laws. Whilst all care has been taken in the preparation of information contained in this web site, no person, including Level One Taxation & Business Advisors Pty Limited, accepts responsibility for any loss suffered by any person arising from reliance on the information provided.

Privacy

Level One highly values the strong relationships we have with our clients. The collection of data at Level One is being handled with full and proper respect for the privacy of our clients. The data we collect is handled sensitively, securely and with proper regard to privacy laws. Level One does not disclose, distribute or sell the data we collect from our clients to third parties.