... in the direction house prices actually move in:
the Australian Bureau of Statistics. So despite the criticisms of this
series-that it's based on detached dwellings only, based on median sales data,
too infrequent, not adjusted for "hedonic" differences between houses, etc.,
it's the only one I trust.
Chris Vedelago
had a very nice piece about how confusing the various commercial house price
statistics are:
The Real Estate Institute of Victoria said the city's
median house price rose 0.9 per cent in the March quarter. Except that,
according to RP Data-Rismark, it fell 1 per cent. Australian Property Monitors,
which is owned by Fairfax, believes prices rose 1.6 per cent in the three-month
period. Residex, on the other hand, estimates values fell 1.9 per cent... ("Confused
about the market? We all are", The Age April 29)
I'm happy to
ignore these numbers-and even more so the spin doctoring that goes with them.
The ABS numbers are in, and they show a 1.1% national fall over the March
quarter. Sydney house prices fell 1.8% according to the ABS, whereas Australian
Property Monitor alleged they rose 1.4%-the latter being the basis for Andrew
"Always Look On the Bright Side" Wilson's latest piece "Confidence rises as
prices bounce back" (SMH April 28). Yeah, right.
Australian
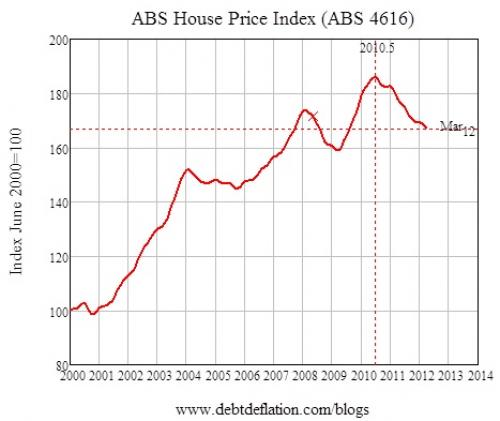
House prices have now fallen 6.1% from their peak, and have been falling for 21
months, which is the longest downturn in nominal prices ever recorded by the
ABS-the previous longest being the 12 months from the beginning of the GFC
(which was terminated by my favourite government policy of all time, the First
Home Vendors Boost).
Figure 1: Nominal house prices have
fallen 6.1% since June 2010

I'm sure the
usual spruikers will come out with why this is now the bottom, and it's a good
time to buy, and there wasn't an Australian house price bubble, and the
shortage will drive up prices, and... So let's put the current data in the
context of the bursting of acknowledged overseas house price bubbles.
Firstly the inflation
adjusted data: in real terms, house prices have now fallen 10% from their June
2010 peak, and are back to a level they first reached in late 2007.
Figure 2: Real house prices have fallen
10% since June 2010

Now let's
compare the Australian experience to date with the Japanese and US
experiences-where no-one, not even Alan Greenspan, denies that there was a
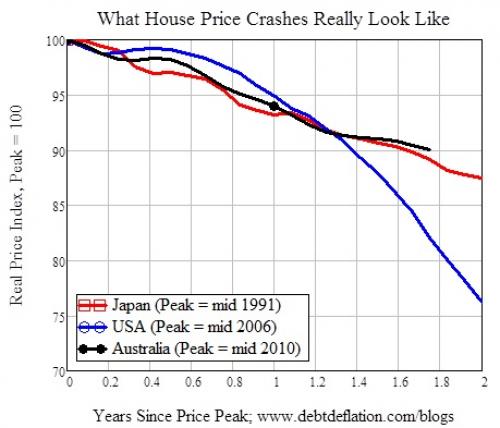
housing bubble. The Japanese bubble peaked in June 1991; the US bubble
peaked in in May 2006; and Australian house prices peaked in June 2010. Figure
3 shows the three declines from the peak, and while the Australian experience
so far is clearly better than the USA's, it's only a whisker better
than the Japanese experience to the same date after the peak.
Figure 3: Comparing Japanese, US and
Australian house prices from their peaks

Anyone who
takes comfort from that should also consider the longer term perspective-see
Figure 4.
Figure 4: The long term picture for Japan and the USA

The motive
force behind Australia's
bubble was the same as in the USA
and Japan:
accelerating debt drove rising house prices during the boom. Now in both those
countries, decelerating debt is driving house prices down. The same pattern
applies in Australia-see
Figure 5.
Figure 5: Mortgage acceleration drives
change in house prices

Don't take
heart from the uptick in acceleration at the end of the series there: for that
to be sustained into the future, ultimately Australian mortgage debt would need
to start rising (compared to GDP). But mortgage debt grew more rapidly here and
reached a higher peak than in the USA (see Figure 6); the odds that
it will rise again are slim.
Figure 6: Australian mortgage debt
exceeded the USA's

And even though
the actual level of mortgage debt is still rising, it's doing so at the slowest
rate ever recorded by the RBA (see Figure 7).
Figure 7: Annual growth in mortgage debt
(with series break in 1991)

The odds are
that the rate of decline will accelerate in the next year-since as Leith van
Onselen pointed out yesterday, many Baby Boomers are relying on rising house
prices to secure their retirements. Now that house prices are falling, and have
been doing so for almost 2 years, many of these Boomers-74% of whom earn less
than $80,000 a year, with the average investor losing over $9,000 a year on
these "investments"-could decide to get out rather than continue to absorb
losses. The unwinding of their leveraged positions could push mortgage growth
below zero, and of course accelerate the house price fall.
Steve Keen is
an economist and author. For more commentary on Australia's debt crisis read DebtWatch
Source: thebull.com.au - for more articles
like this go to The Bull's website
12th-June-2012 | 
