The table below provides details of the movement in average investment returns from various asset classes for the period up to 31 January 2020.
|
Asset class (% change)
|
1 month
|
3 months
|
1 year
|
3 years
(% pa)
|
|
Australian shares
|
5.0
|
6.1
|
24.7
|
12.4
|
|
Smaller companies
|
3.4
|
4.7
|
18.8
|
12.1
|
|
International shares (unhedged)
|
4.3
|
8.3
|
28.3
|
16.3
|
|
International shares (hedged)
|
-0.4
|
5.2
|
18.3
|
11.2
|
|
Emerging markets (unhedged)
|
0.1
|
5.3
|
13.1
|
12.5
|
|
Property - Australian listed
|
6.3
|
4.1
|
19.9
|
13.6
|
|
Property - global listed
|
1.3
|
0.3
|
12.7
|
9.7
|
|
Australian fixed interest
|
2.3
|
1.5
|
9.1
|
5.7
|
|
International fixed interest
|
1.8
|
1.3
|
8.1
|
4.9
|
|
Australian cash
|
0.1
|
0.2
|
1.4
|
1.7
|
Past performance is not a reliable indicator of future performance. The Global Listed property reference index changed to FTSE EPRA/NAREIT Developed Rental NR Index (AUD Hedged) as of August 2019
Overview and outlook
The declaration by the World Health Organisation (WHO) that the outbreak of 2019 Novel Coronavirus (2019 nCoV) is a global health emergency sent market volatility higher. At the time of writing there have been 17,496 confirmed cases of Coronavirus with 188 of those outside mainland China. Sadly 362 people have died as a result. This now exceeds the SARS outbreak of 2002/03 although pleasingly the survivorship rate does appear to be better. More information is available here.
The outbreak has resulted in elevated uncertainty as the response impacts the economy through reduced travel and tourism activity. With the Chinese authorities putting Wuhan and 15 other cities in Hubei province in lock down and extending the Chinese New Year holiday by 2 days, Chinese economic growth expectations are now being lowered. UBS for example has reduced their China real GDP growth expectation for 2020 to 5.4% from 6.0% previously. With some parts of the world banning travellers coming from mainland China there will be flow on impacts into those economies as a result of the reduced tourism.
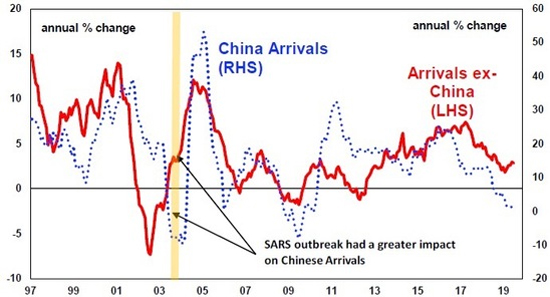
Locally the reduced number of travellers from China as demonstrated on the chart below will have a meaningful impact, because as a share of all visitor arrivals China has increased from just a few percent at the time of the SARS outbreak to around 15% currently.
The caution that will likely arise as a result of the outbreak will likely depress consumption and potentially investment in the region and Australia.
Overseas Arrivals in Australia

Source: ABS, AMP Capital
This will likely impact Australian tourism operators, transport providers such as airlines and airports as well as the accommodation industry. Perhaps a little surprising is that it is also expected to impact trade particularly to and from China. The Australian economy is also likely to have negative impacts from the ongoing bushfire crisis and storm damage which occurred in January.
The question is to what extent these events will impact the economy and clearly if the coronavirus is not largely contained shortly, the impacts will be more drawn out. History does show however that despite the human cost of such events that the economic impacts are short lived and are not significant for financial markets.
The impact for markets is likely to be positive for bond investors and will go toward explaining the 1.8% return experienced in January for international fixed interest. However, the issues are clearly likely to be headwinds for growth assets particularly equities and those areas of the market directly impacted, in the short-term. We saw Chinese shares fall 8% on the first trading day following the extended lunar holiday.
Share markets
The Australian share market (+5.0%) was strong following a weak December and made up some lost ground on international share markets.
Strength was seen in growth stocks and large companies with the Small cap (+3.4%) component of the market unable to keep up. Health care (+12.0%), Info tech (+11.1%) and Telecom services were the strongest sectors in the market. Utilities (+0.6%), energy (+0.7%) and resources (+0.8%) were the weakest performing sector with all areas of the market rising through the month.
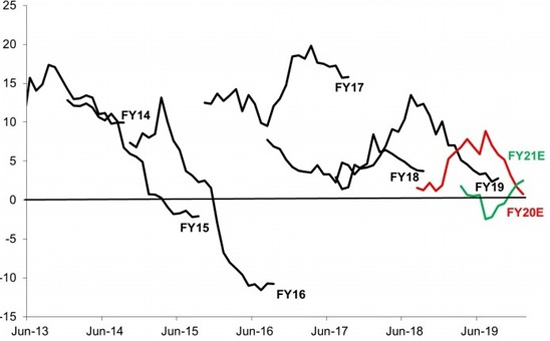
With reporting season commencing in February it is clear that 2020 earnings expectations continue to decline with little to no growth now expected. The chart below shows that the earning recovery is now being pushed into 2021.
Australian Market EPSg profile (%)

Source: Macquarie Research January 2020
In international markets, returns (-0.4%) on a currency hedged basis were weak in January on concerns around the coronavirus. Chinese stocks (-5.6%) unsurprisingly underperformed with the UK (-3.4%) impacted by the pending 31st of January Brexit. US shares (0.0%) which make up around 65% of the global market were relatively better.
US shares are being supported by some improvement in earnings with earnings for the December quarter expected to have risen 0.7% on the previous corresponding period. This was previously expected to be a 0.3% decline and has been supported by stronger than expected result from the likes of Microsoft, Apple and Intel and while 2019 has been a lacklustre year for US earnings growth, improvement in 2020 is expected.
Currency movements meant that unhedged international shares (+4.3%) performed relatively well and assisted the Emerging market return in Australian dollars (+0.1%). We consider a mix of hedged and unhedged exposure as desirable to increase portfolio diversification and allow for unexpected outcomes in markets that have a flow on impact to Australian dollar exchange rates.
Interest Rates
The Australian fixed interest market (+2.3%) performed well in January as investors moved into more defensive and safe haven assets in light of the coronavirus outbreak. This move saw the Australian 10-year bond yield fall 46 basis points to 0.91% and heading toward the August all-time low. US 10-year bond yield fell 40.5 basis point to 1.505% as investors sought to defend their positions from potential weakness in light of the corona virus outbreak. As a result, international fixed interest (+1.8%) also performed well through January
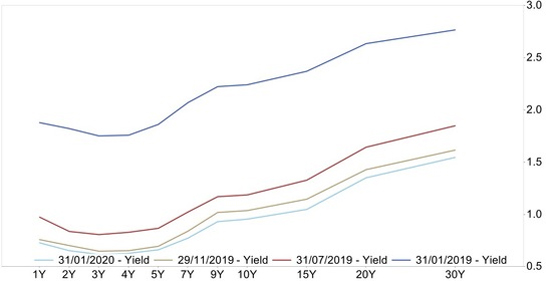
Yields across the curve i.e. for all time periods, are near their lowest levels ever seen in the Australian government bond market. This reflects the weakness expected in economic activity and the likelihood of further rate cuts from the RBA. The issues in China, combined with the bushfire crisis haven’t helped an already challenged domestic economy.
Australia Treasury Yield

Source: FactSet, AMP
Property
The Australian listed property market (+6.3%) was a strong performer and outpaced the broader share market. There was particular strength in industrials (11.2%) largely driven by Goodman, health care (+8.4%) and specialised REITs (+9.6%) were the strongest performing areas of the REIT market. Residential REIT Ingenia Communities Group was down (-3.6%), the worst in the market. International listed property (+1.3%) saw positive returns despite the weakness in global growth assets.
AMP
| 


