The table below provides details of the movement in average investment returns from various asset classes for the period up to 28 February 2019.
|
Asset class (% change)
|
1 month
|
3 months
|
1 year
|
3 years
(% pa)
|
|
Australian shares
|
6.0
|
10.0
|
7.1
|
12.9
|
|
Smaller companies
|
6.8
|
8.0
|
3.5
|
13.4
|
|
International shares (unhedged)
|
5.6
|
5.2
|
10.1
|
12.8
|
|
International shares (hedged)
|
3.4
|
1.5
|
2.4
|
13.3
|
|
Emerging markets (unhedged)
|
2.7
|
8.9
|
-1.3
|
15.2
|
|
Property - Australian listed
|
1.8
|
9.7
|
18.9
|
8.9
|
|
Property - global listed
|
0.2
|
3.0
|
15.9
|
7.2
|
|
Australian fixed interest
|
0.9
|
3.1
|
6.2
|
3.5
|
|
International fixed interest
|
0.1
|
2.5
|
3.7
|
2.9
|
|
Australian cash
|
0.2
|
0.5
|
2.0
|
1.9
|
Overview and outlook
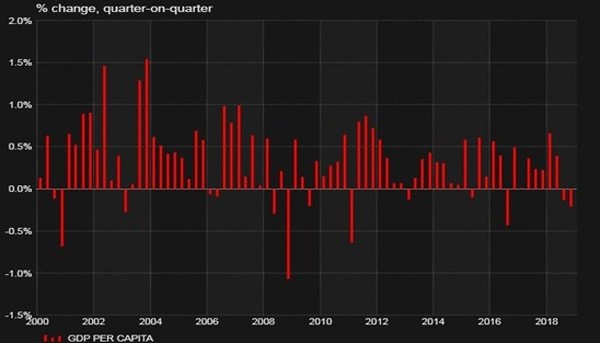
The Australian economy, so resilient for so long, is clearly now seeing meaningful weakness. Economic growth on a per capita basis (i.e., per person) shrank both in the September and December quarters as evidenced by yesterday’s data release. This indicates that on a per person basis, output has contracted and is being widely referred to as a “per capita recession”, something we haven’t seen since 2006.
Gross domestic produce per capita

Source: Thomson Reuters Datastream, ABS, ABC News
New car sales fell dramatically in February down more than 9 percent compared to the previous corresponding period. Residential house prices continue to decline and have now experienced a worse decline from their September 2017 peak than what was experienced in the GFC. In addition, housing credit growth has slowed to its weakest on record and the question may be, “is there more than one canary in the coal mine?”
With anecdotal evidence of increasing unemployment for example, WA’s unemployment has risen to the highest rate since 2002, there are more commentators suggesting that the RBA will likely cut rates this year perhaps twice.
Looking overseas, data from the US continues to be mixed with US GDP growth slowing to 2.6 percent annualised however this was stronger than anticipated. Housing starts in the US saw an 11% decline in December and the manufacturing index while still suggesting growth fell in February. Additionally, we saw some progress on the trade tensions with China, and Pres Trump delaying US tariff increases on Chinese imports.
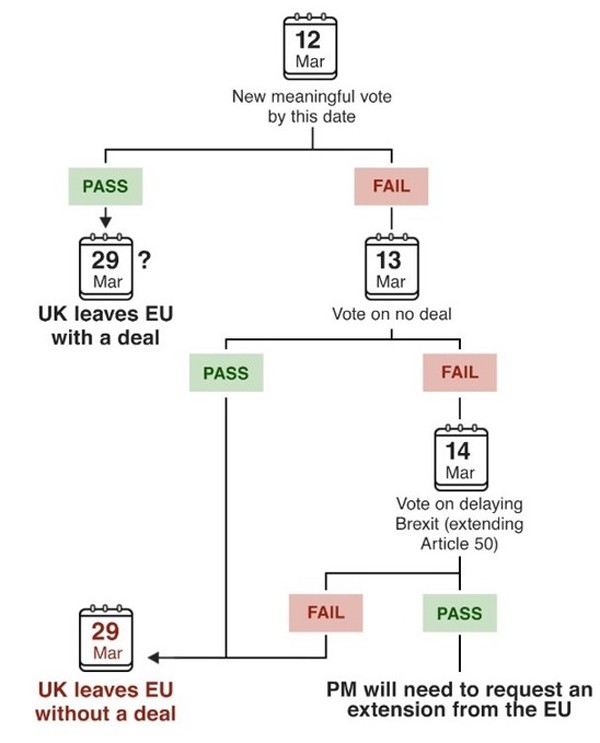
The UK’s situation remains unclear as the Brexit deadline fast approaches. Efforts continue to ensure legally binding changes are made to the deal with a vote on the deal in Britain to occur by the 12th. There are also meetings with the EU to get guarantees around the backstop plan to avoid border checks in Ireland. Should the deal be rejected a vote on leaving without a deal will take place on the 13th. Finally, the door has been opened on delaying Brexit should no deal be agreed, with a vote on the 13th to potentially extending negotiations should the vote on the deal fail.
Mrs May's revised Brexit timetable

Source: BBC News
Share markets
Australian shares continued the strong start to 2019 rising strongly, up 6.0%. Financials (9.1%) were the strongest sector following the final report of the Hayne Royal Commission which was surprisingly lenient on vertical integration. Energy (7.9%) also performed well with a surge in crude oil prices of around 9%. Weakness was seen in Consumer staples (-1.5%) as consumer spending continues to show signs of weakness, while Health care (1.0%) was also among the weaker performing sectors and seemed to suggest a market move into more market sensitive stocks.
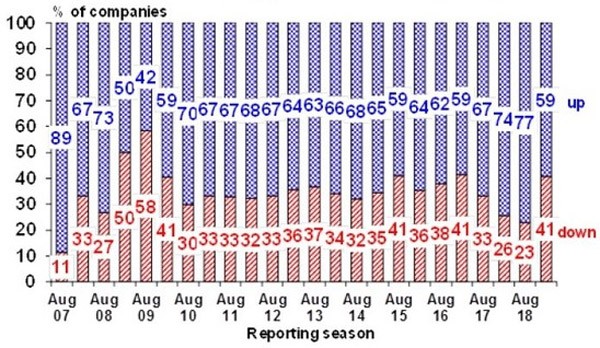
The reporting season for the period end December 2018 was in full force in February and saw mixed results. It was better than some feared however it did confirm a slowdown in domestic focused companies. Companies that saw profits down relative to a year prior was around the equal highest level seen since 2010 at 41%.
Australian company profits relative to a year ago

Source: AMP Capital
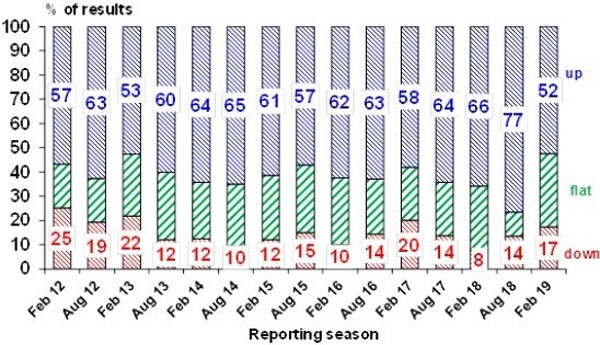
Another area of weakness in these results was the number of companies that increased their December dividend which was the weakest seen in many years at 52 percent.
Australian dividends relative to a year ago

Source: AMP Capital
While earnings growth for the financial year is still expected to be respectable, circa 5%, this is largely supported by the growth expected in resource companies and the impact of higher iron ore prices. Excluding resources consensus earnings expectations are now just 2% for the 2019 financial year.
The combination of less optimism of companies as reflected by the changes in dividends and the earning expectations of the market which has some support from company messaging the outlook for Australian shares is a little more challenging than where we have been at the end of past reporting periods.
International shares (3.4%), on a currency hedged basis, under-performed the local market but with weakness in the Australian dollar un-hedged international shares (5.6%) were closer to the mark. Brexit, a potential slowing US economy combined with trade tensions and a slowing Chinese economy all continue to contribute to global investor concerns. Chinese stocks listed in Shanghai were particularly strong rising 14.6% in RMB.
Interest rates
Australian fixed interest (0.9%) was reasonably strong considering the strength in growth assets. International fixed interest (0.1%) was effectively steady.
Bond yields continue to fall in Australia with 10-year yield dropping 12 bps to 2.11% driven by weakening economic conditions and increasing likelihood that the next move by the Reserve Bank is a cut in interest rate. In the US the 10-year yield rose 9 bps to 2.71%.
Property
Listed property markets were also positive however they didn’t see the strength of the broader equity markets. Australian REITs (1.8%) outperformed the international counterpart (0.2%) on a currency hedge basis.
AMP
| 


