Given the understanding that the psychology
of the markets actually moves the markets, we can acknowledge that psychology
develops and ends the trends we are going to look at today.
Learning how to
identify the trend should be the first order of business for any student of
technical analysis. Most investors, once invested in an uptrend, will stay
there looking for any weakness in the ride up, which is the indicator needed to
jump off and take the profit.
Primary Markets
The bull and
bear markets are also known as primary markets; history has shown us that the
length of these markets generally lasts from one to three years in duration.
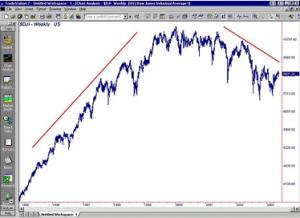
Chart Created with Tradestation
You can see in
the chart that the bull market preceding the most recent three-year slide
lasted much longer than the average trend duration of which I spoke above; if
certain economic factors don't soon resolve themselves, the bear market may be
somewhat longer than most would like to see.
Secular Trends
A secular
trend, one that can last for one to three decades, holds within its parameters
many primary trends, and, for the most part, is easy to recognize because of
the time frame. The price-action chart, for a period of 25 years or so, would
appear to be nothing more than a number of straight lines moving gradually up
or down. Have a look for a moment at the chart of the S&P 500 below. I have
taken the chart back to early the 1980s to show you the rise of the market
leading up to the turn of the century.
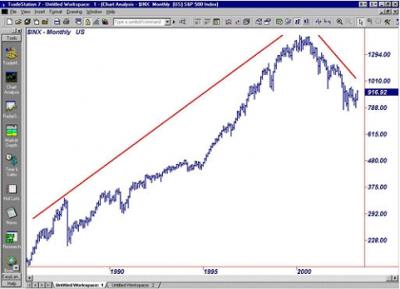
Chart Created with Tradestation
Intermediate-Trends
Within all
primary trends are intermediate trends, which keep the business journalists and
market analysts constantly searching for the answers for why an issue or a
market suddenly turns and heads in the direction opposite to that of yesterday
or last week. Sudden rallies and directional turnarounds make up the
intermediate trends and, for the most part, are the results of some kind of
economic or political action and its subsequent reaction.
History tells
us that the rallies in bull markets are strong and that the reactions are
somewhat weak. The flip side of the coin shows us that bear-market reactions
are strong and that the rallies are short. Hindsight also shows us that each
bull and bear market will have at least three intermediate cycles. Each
intermediate cycle could last as little as two weeks or as long as six to eight
weeks.
Long-Term Trends
To determine
the long-term trends that appear on the charts of their favorite stocks,
veteran analysts will use a stochastics indicator. My favorite, however, is the
momentum indicator called the rate of change (ROC) (which you can read about in
Rate of Change):
The normal time
frame for ROC measurement is 10 days. The ratio to build the ROC indicator is
as follows:
Rate of Change
= 100 (Y/Yx)
"Y"
represents the most recent closing price, and Yx represents the closing price a
specific number of days ago. So, if the price of a stock closes higher today
than it did 10 days ago, the ROC value point will be above the equilibrium,
thus indicating to chartists that prices are rising in that particular issue.
Conversely, if the price in today's session closes lower than it did 10 trading
days ago, the value point will be below the equilibrium, indicating that prices
are falling off. It is safe to say that if the ROC is rising, it gives a
short-term bullish signal, and a bearish sign would have the ROC falling.
Chartists pay great attention to the time period in the calculation of ROC.
Long-term views of the market or a specific sector or stock, will use perhaps a
26- to 52-week time period for Yx and a shorter view would use 10 days to six
months or so.
You can see
that, by changing the number of days or weeks as a time frame, the chartist can
better determine the direction and duration of the trend.
The Bottom Line
Markets are
made up of several different kinds of trends, and it is the recognition of
these trends that will largely determine the success or failure of your long
and short-term investing.
By Investopedia.com
| 23.1.2012
By www.thebull.com.au
- for more articles like this go to The Bull's website Australia's
pre-eminent news and investing site for investors and traders, covering shares,
superannuation, property, financial planning strategies and more.
18th-January-2012 |